KodiakTM PCIe 6.0 / CXL 3.x Protocol Test System
Introducing the State-of-the-Art Architecture of Kodiak
Experience Unmatched Protocol Analysis Capabilities
Kodiak has a state-of-the-art architecture that revolutionizes the standards of protocol analyzers. With its innovative design and comprehensive feature set, Kodiak empowers CXL, PCIe, and NVMe developers with unparalleled visibility into complex PCI Express designs and enables efficient analysis of PCIe, CXL, and NVMe protocols.

Advanced Web Browser-Based BusXpert™ Application
By leveraging the familiarity and accessibility of web browsers, Kodiak simplifies the user experience and increases productivity. Kodiak comes equipped with the advanced BusXpert™ application, accessible through a web browser interface or an identical standalone software application. This intuitive application allows users to access powerful analysis tools, configure analyzer settings, and monitor device status conveniently.
Suite of Powerful Triggers, Filters, and Trace Processing
Kodiak offers a comprehensive suite of PCIe, CXL, and NVMe triggers, filters, and powerful trace processing capabilities. These advanced tools provide users with precise control over data acquisition, allowing them to capture and analyze specific events of interest.
Flexible Trace Storage
Kodiak offers a highly flexible trace storage solution to meet the diverse needs of users. Our trace storage is designed to provide easy access and sharing of trace files. Users can save traces directly to Kodiak’s internal SSD storage and do not need to download large trace files to their local PC. Once saved, traces can be easily opened within the Kodiak or downloaded to a client for further analysis. To facilitate efficient data management, traces can be conveniently zipped within Kodiak before downloading.
With up to 8TB of internal SSD storage, users can store an ample amount of trace data for analysis and reference. The storage capacity is further expandable with the option of external storage via two USB 3.1 ports and two PCIe OCuLink ports.
Multi-User Access and Extensive Trace Buffering
Kodiak supports multi-user access, allowing multiple people to collaborate and work on traces simultaneously. This collaborative workflow streamlines teamwork and accelerates project timelines. Additionally, Kodiak’s extensive trace buffering capabilities ensure that vital trace data is retained, even during high-speed data capture scenarios. Developers can access and review trace information efficiently, ensuring accurate analysis, comprehensive troubleshooting, and error-free root cause analysis.
Compact and Portable Design
Designed with convenience in mind, Kodiak features a compact and portable design with an included hardshell travel case to protect the equipment investment. Its sleek form factor and construction make it portable and suitable for on-site testing, enabling engineers to tackle protocol analysis tasks anywhere, anytime. With Kodiak, developers can efficiently conduct tests and validations in diverse environments, ensuring the smooth functioning of PCIe, CXL, and NVMe protocols.
Stay Ahead with Kodiak’s State-of-the-Art Architecture
Investing in Kodiak enables developers to stay ahead of the curve in the dynamic world of PCIe, CXL, and NVMe protocols. Its state-of-the-art architecture, combined with its user-friendly interface and powerful analysis capabilities, provides unparalleled visibility into the complex intricacies of protocol designs. With Kodiak by your side, unlock the true potential of PCIe development, streamline your processes, shorten development cycles, and expedite your time to market, propelling your projects to success.
Powerful Kodiak Features:
- CXL, PCIe, NVMe, DOE/IDE, SMBUS and all sideband signals supported
- No tuning required (i.e. No calibration). Kodiak’s Rx automatically and quickly equalizes (EQs) the PCIe signals at all data rates
- Embedded trace processing architecture and accelerated performance
- Deep Trace Buffers: 256GB
- Internal Trace Storage (SSD): 8TB
- Direct Attach Storage
- Two OCuLink (PCIe) ports
- Two USB 3.1 ports
- Network and Direct Connectivity
- Two 10GbE SFP+ (optical/copper)
- One 1GbE RJ-45
- Real-time traces in memory (prior to saving). Users can review and analyze captured traces without downloading the trace to a client PC
- Touchscreen LCD for analyzer setup, control, and status
BusXpert Software
Convenient User Interfaces – Web Browser & Standalone Application
One major aspect of the Kodiak Analyzer is its convenient user interface, which can be accessed through a web browser or SerialTek’s Electron®-based application. This user-friendly interface provides a suite of powerful triggers, filters, and trace processing capabilities, allowing users to easily decode and analyze their data.
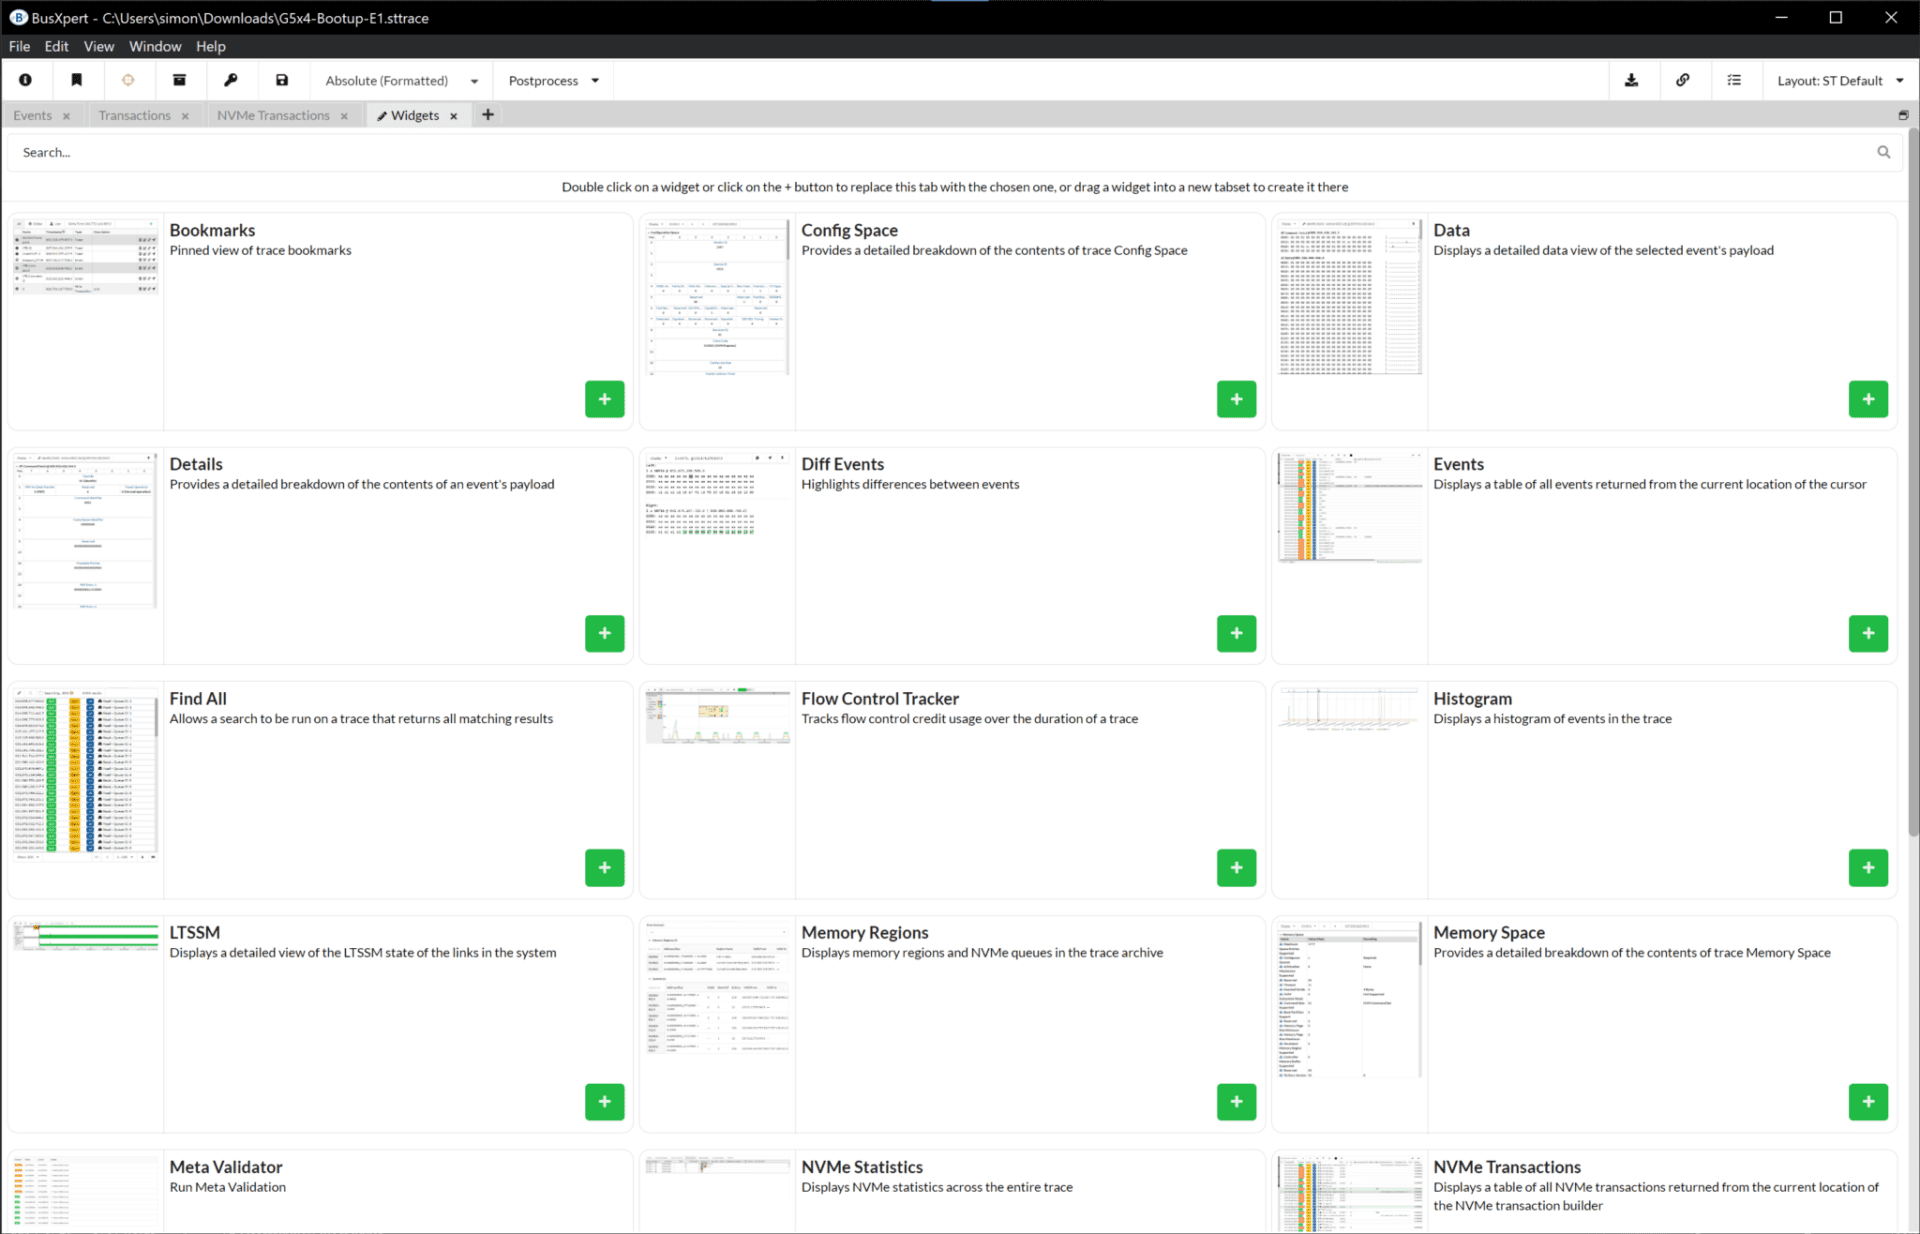
The interface features customizable views and widgets that allow users to analyze trace data in various formats. These widgets have specific controls tailored to their functionality, and there is also a global toolbar that applies to all widgets.
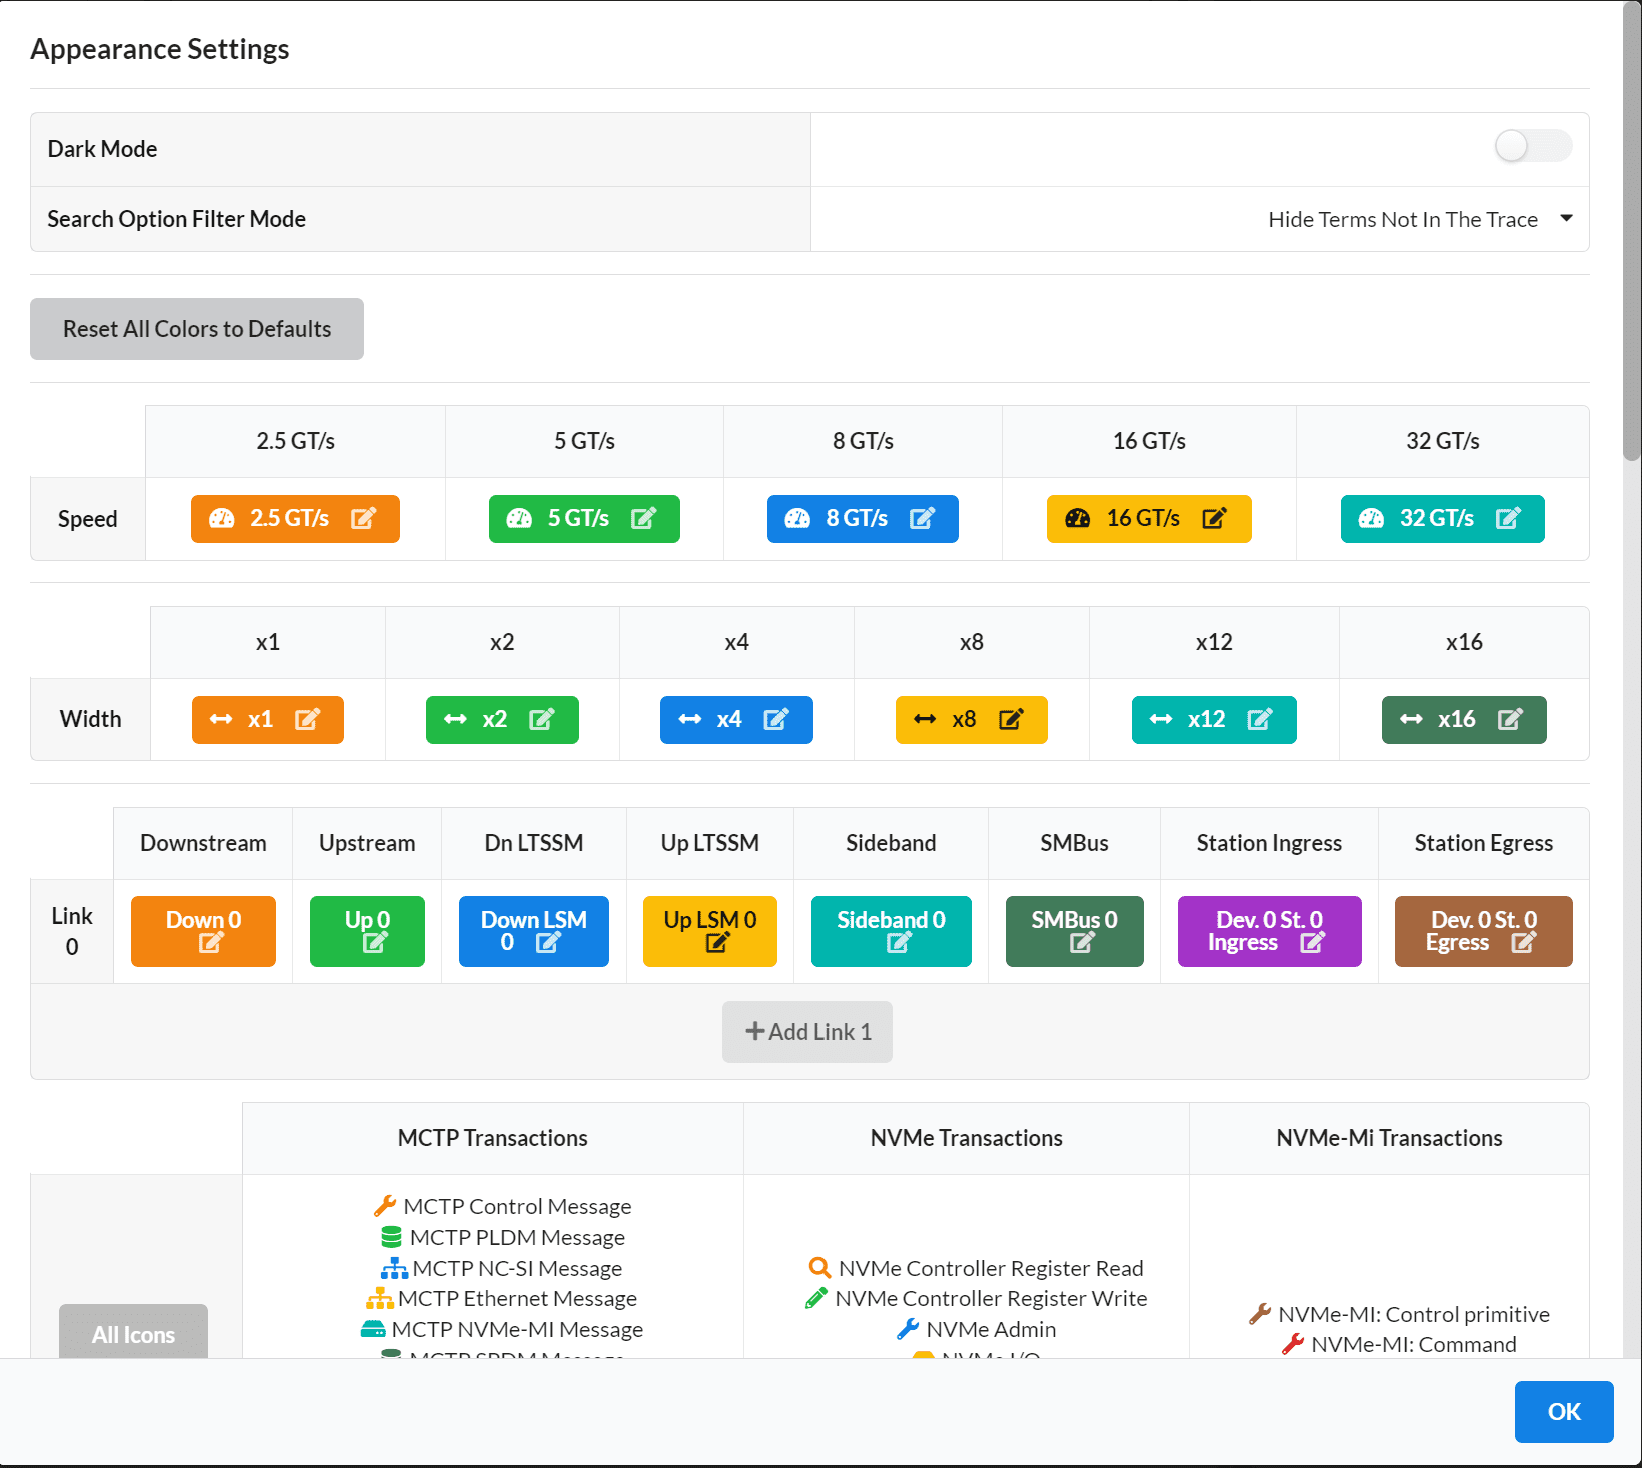
To further enhance ease of use, a layout manager is available, enabling users to customize their Home, Capture, and Trace Viewing screens. This allows for a personalized and efficient workflow.
Additionally, the Kodiak PCIe 6.0 Analyzer offers easy automation through its REST API. This API provides programmatic facilities for monitoring and capturing traffic, performing statistical analyses, and conducting detailed searches. By utilizing the REST API, users can streamline their automation processes and achieve greater efficiency.
Overall, the convenient user interface of the Kodiak PCIe 6.0 Analyzer, accessible through a web browser or standalone application, ensures fast, reliable, and user-friendly decoding and analysis of trace data.
BusXpert Widgets (Views)
Events
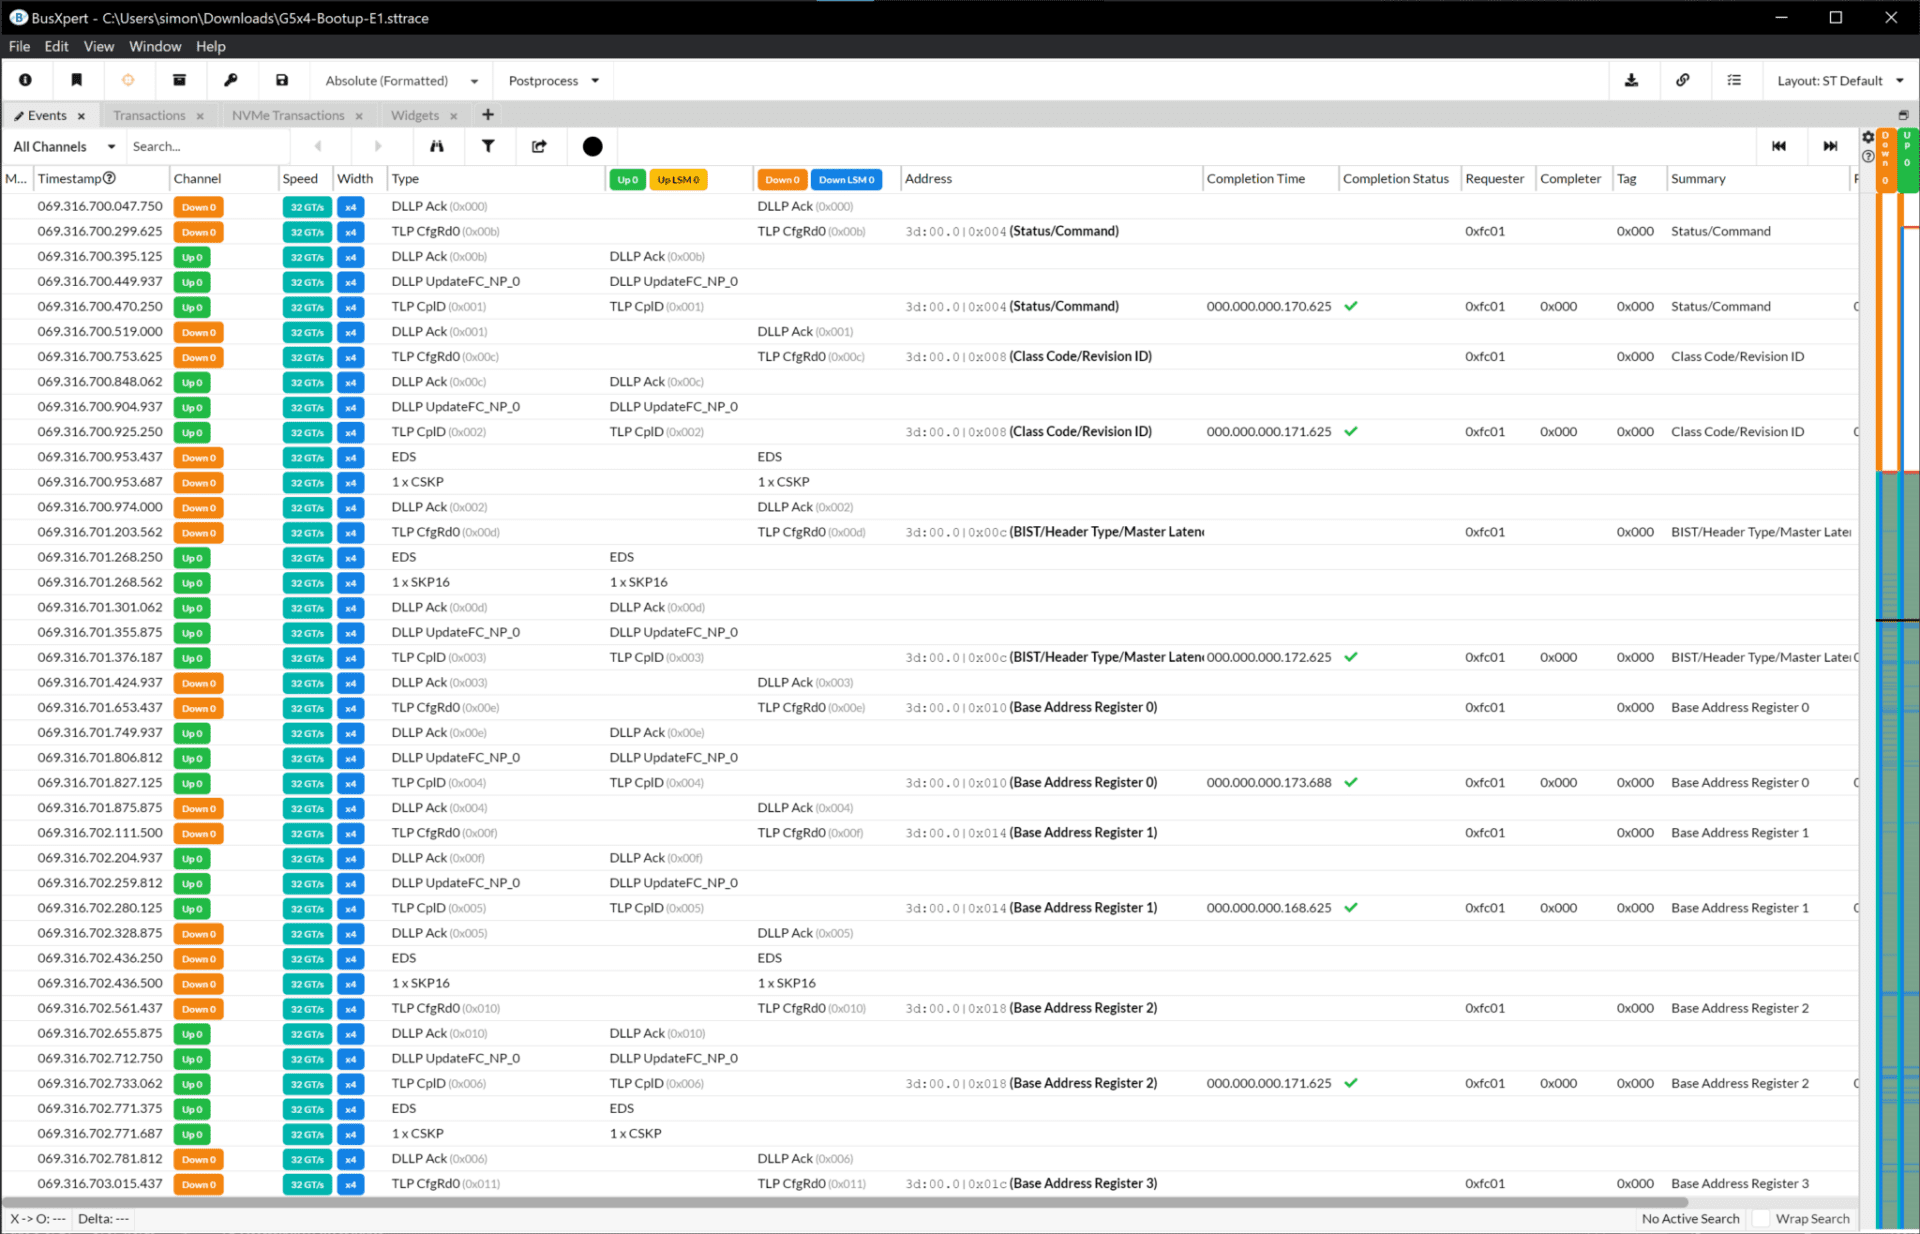
The Events View Widget is a powerful Kodiak PCIe 6.0 Analyzer view used to analyze trace data in a comprehensive manner. This widget provides a convenient and organized representation of events occurring on the bus, such as OS’s, DLLP’s, TLP’s, LTSSM, and more.
Within the widget, each event is displayed in a separate row, accompanied by a timestamp indicating when the event occurred on the bus. The corresponding data from each event is populated in the respective columns, making it easy to analyze and interpret.
To enhance the user experience, the Events View Widget includes a toolbar with several controls to navigate through the data, providing the ability to move the widget to specific positions in the trace. Additionally, users can customize their view by removing events that are not of interest, ensuring a clear and focused analysis. Furthermore, a right-click menu offers additional functionality to further refine the analysis.
Overall, the Events View Widget in the Kodiak PCIe 6.0 Analyzer provides a comprehensive and user-friendly interface to explore, analyze, and gain valuable insights from the trace data. Its intuitive controls, customizable display, and organized representation of events enhance the efficiency and effectiveness of the analysis process.
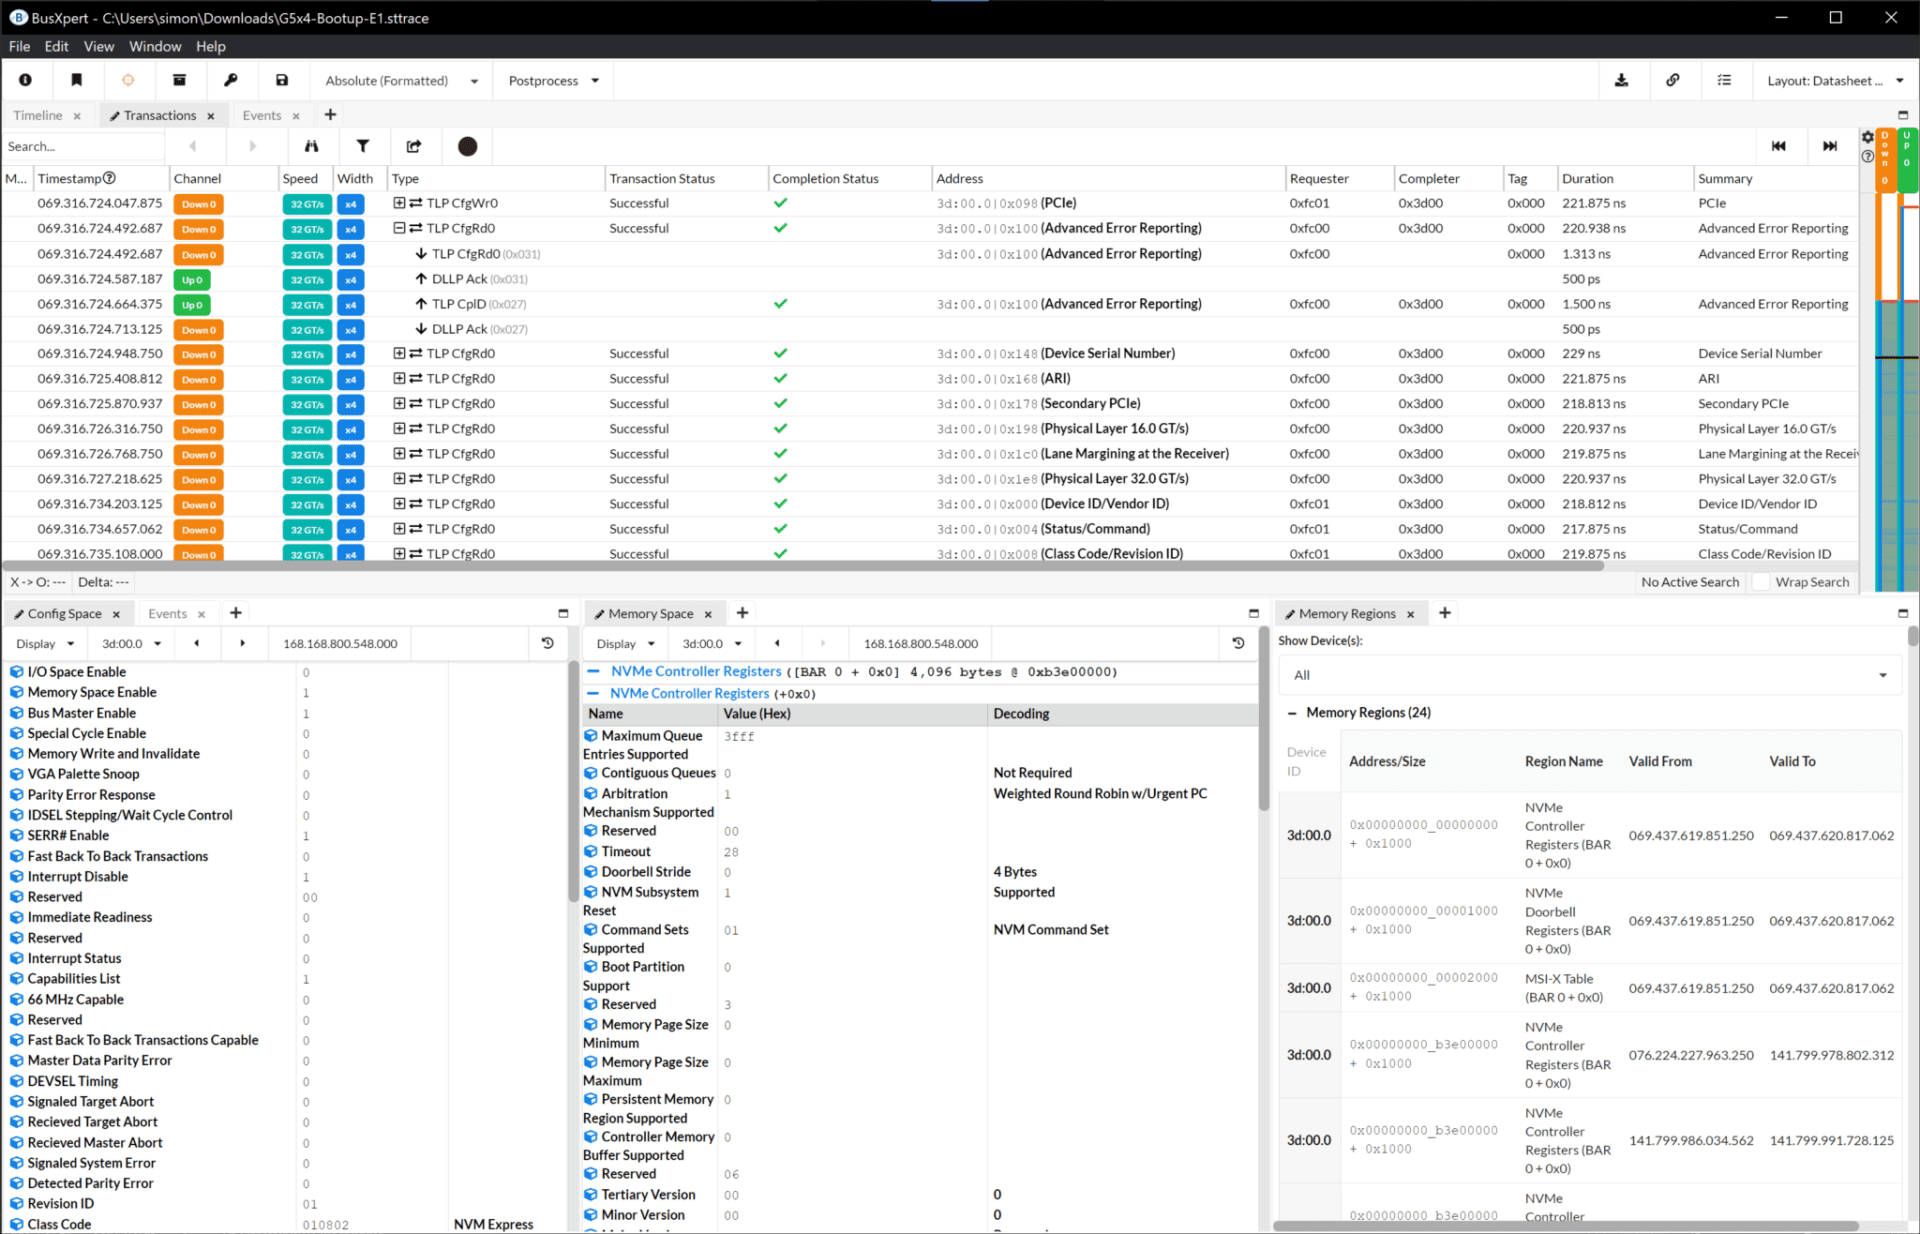
PCIe/CXL and NVMe Transactions
![]()
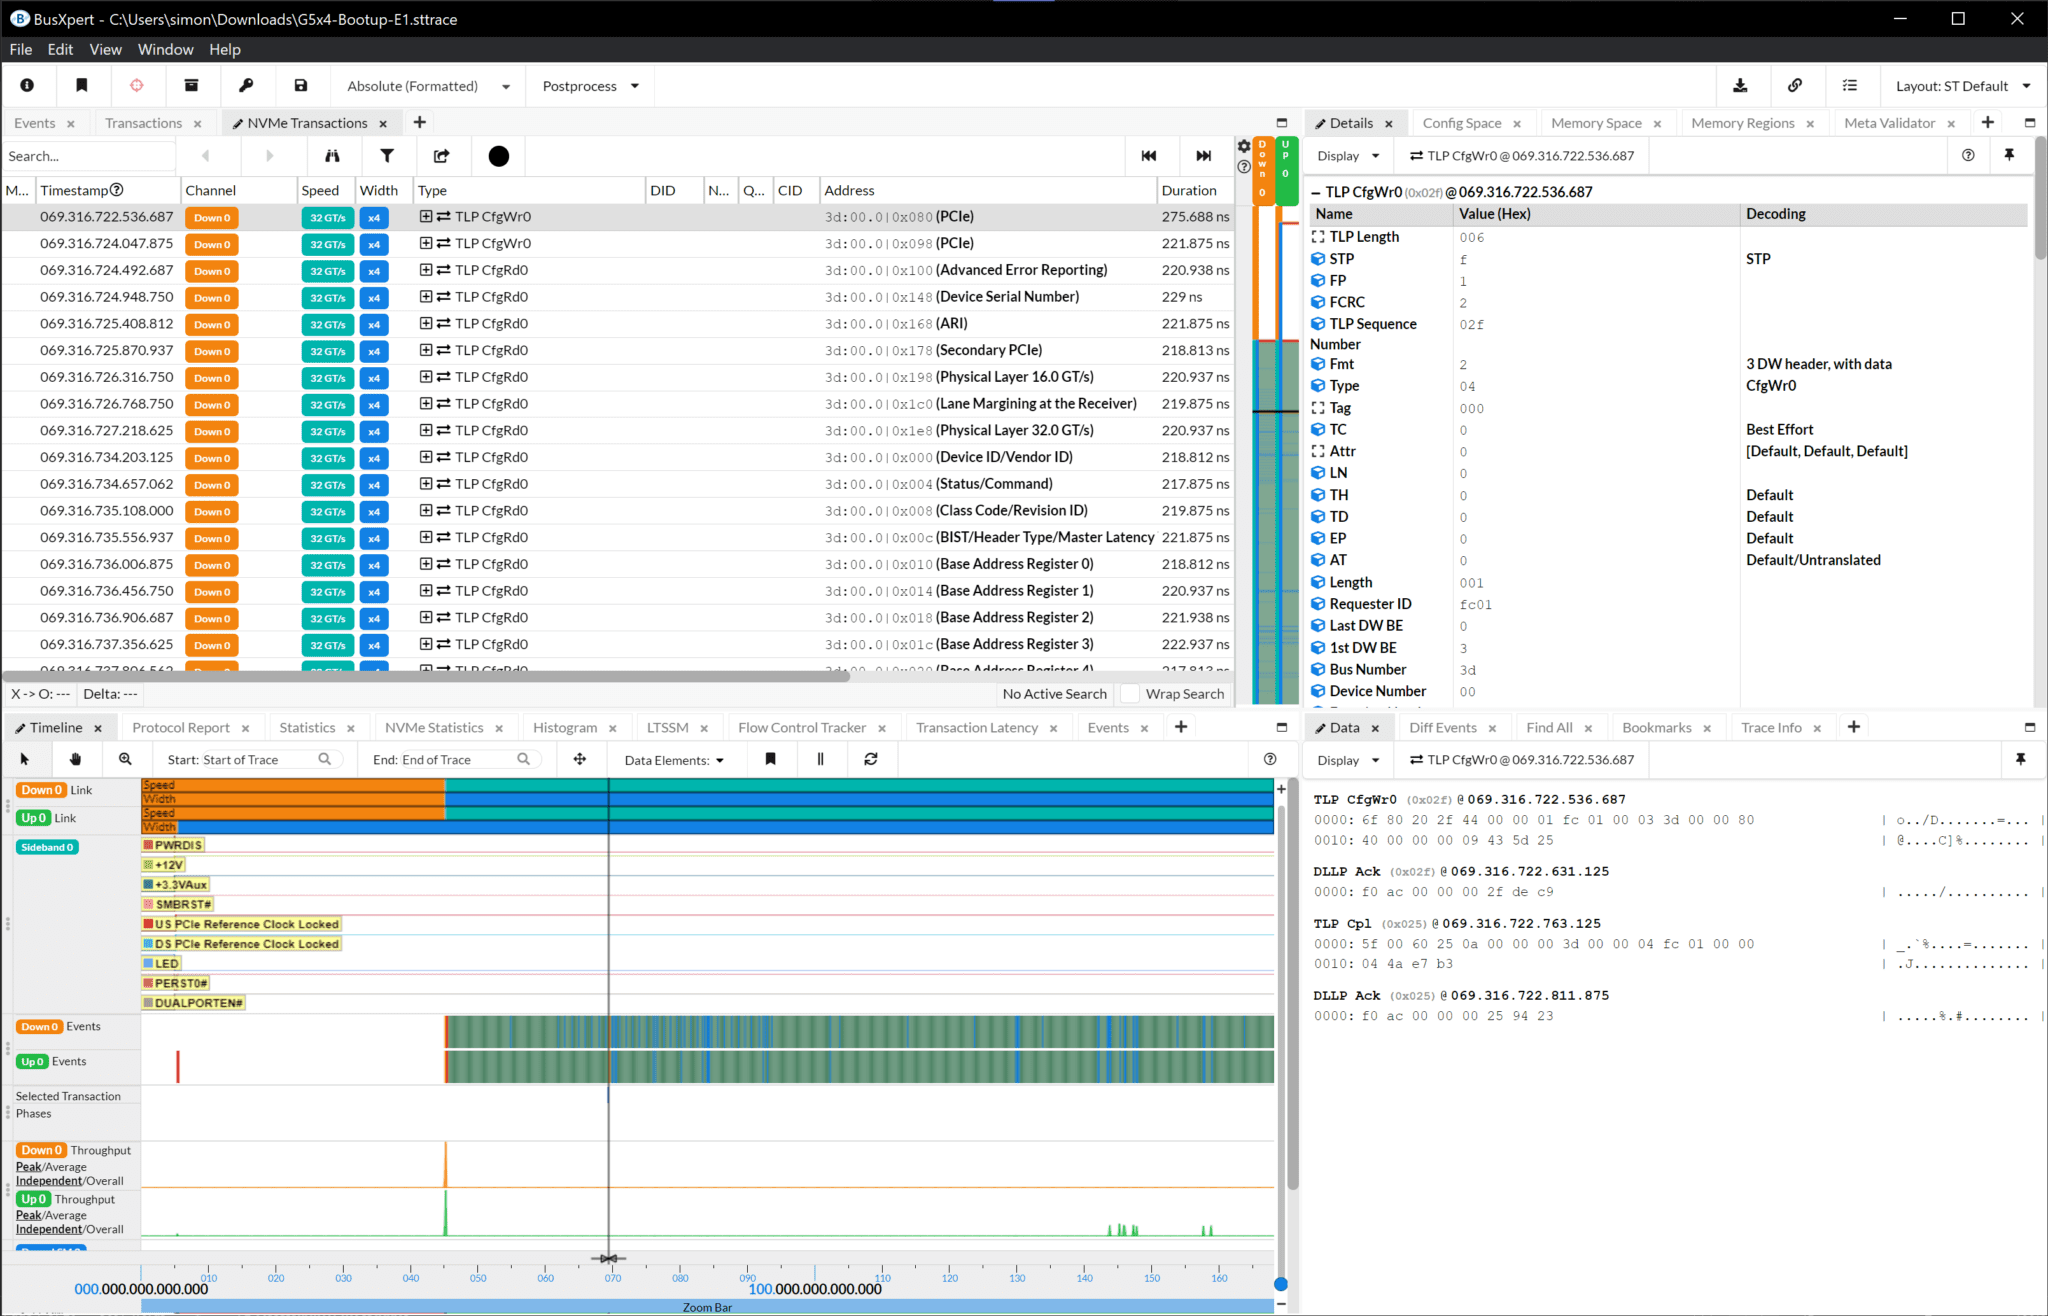
These widgets organize the individual events into coherent sequences, forming complete transactions on the bus.
A transaction typically consists of commands sent from one side of the stream and the corresponding responses received from the other side. To provide a clear and concise view of the transactions, the widgets offer expanded and collapse functionality. When expanded, all the events within the transaction are visible, allowing users to examine each event individually. Conversely, when collapsed, only a summary of the transaction is displayed, enabling users to quickly grasp the overall flow without getting overwhelmed by excessive event information.
Each row within the Transaction View Widgets represents a specific packet, providing essential details about the packet it represents. The columns are filled with information extracted from the packet, making it easy for users to access and analyze the relevant data. These details may include packet types, opcode values, addresses, data payloads, and more, depending on the specific packet type and protocol being analyzed.
![]()
By utilizing the Transaction View Widgets, users can gain a deeper understanding of the sequence and structure of events within each transaction. This allows for efficient analysis and troubleshooting, as users can identify any anomalies, errors, or critical insights related to command and response interactions.
The Transaction View Widgets, in combination with other analysis tools and features provided by Kodiak, empower users to thoroughly evaluate the intricacies of bus transactions. This enhanced visibility and control enable more effective analysis, debugging, and optimization of PCIe communication.
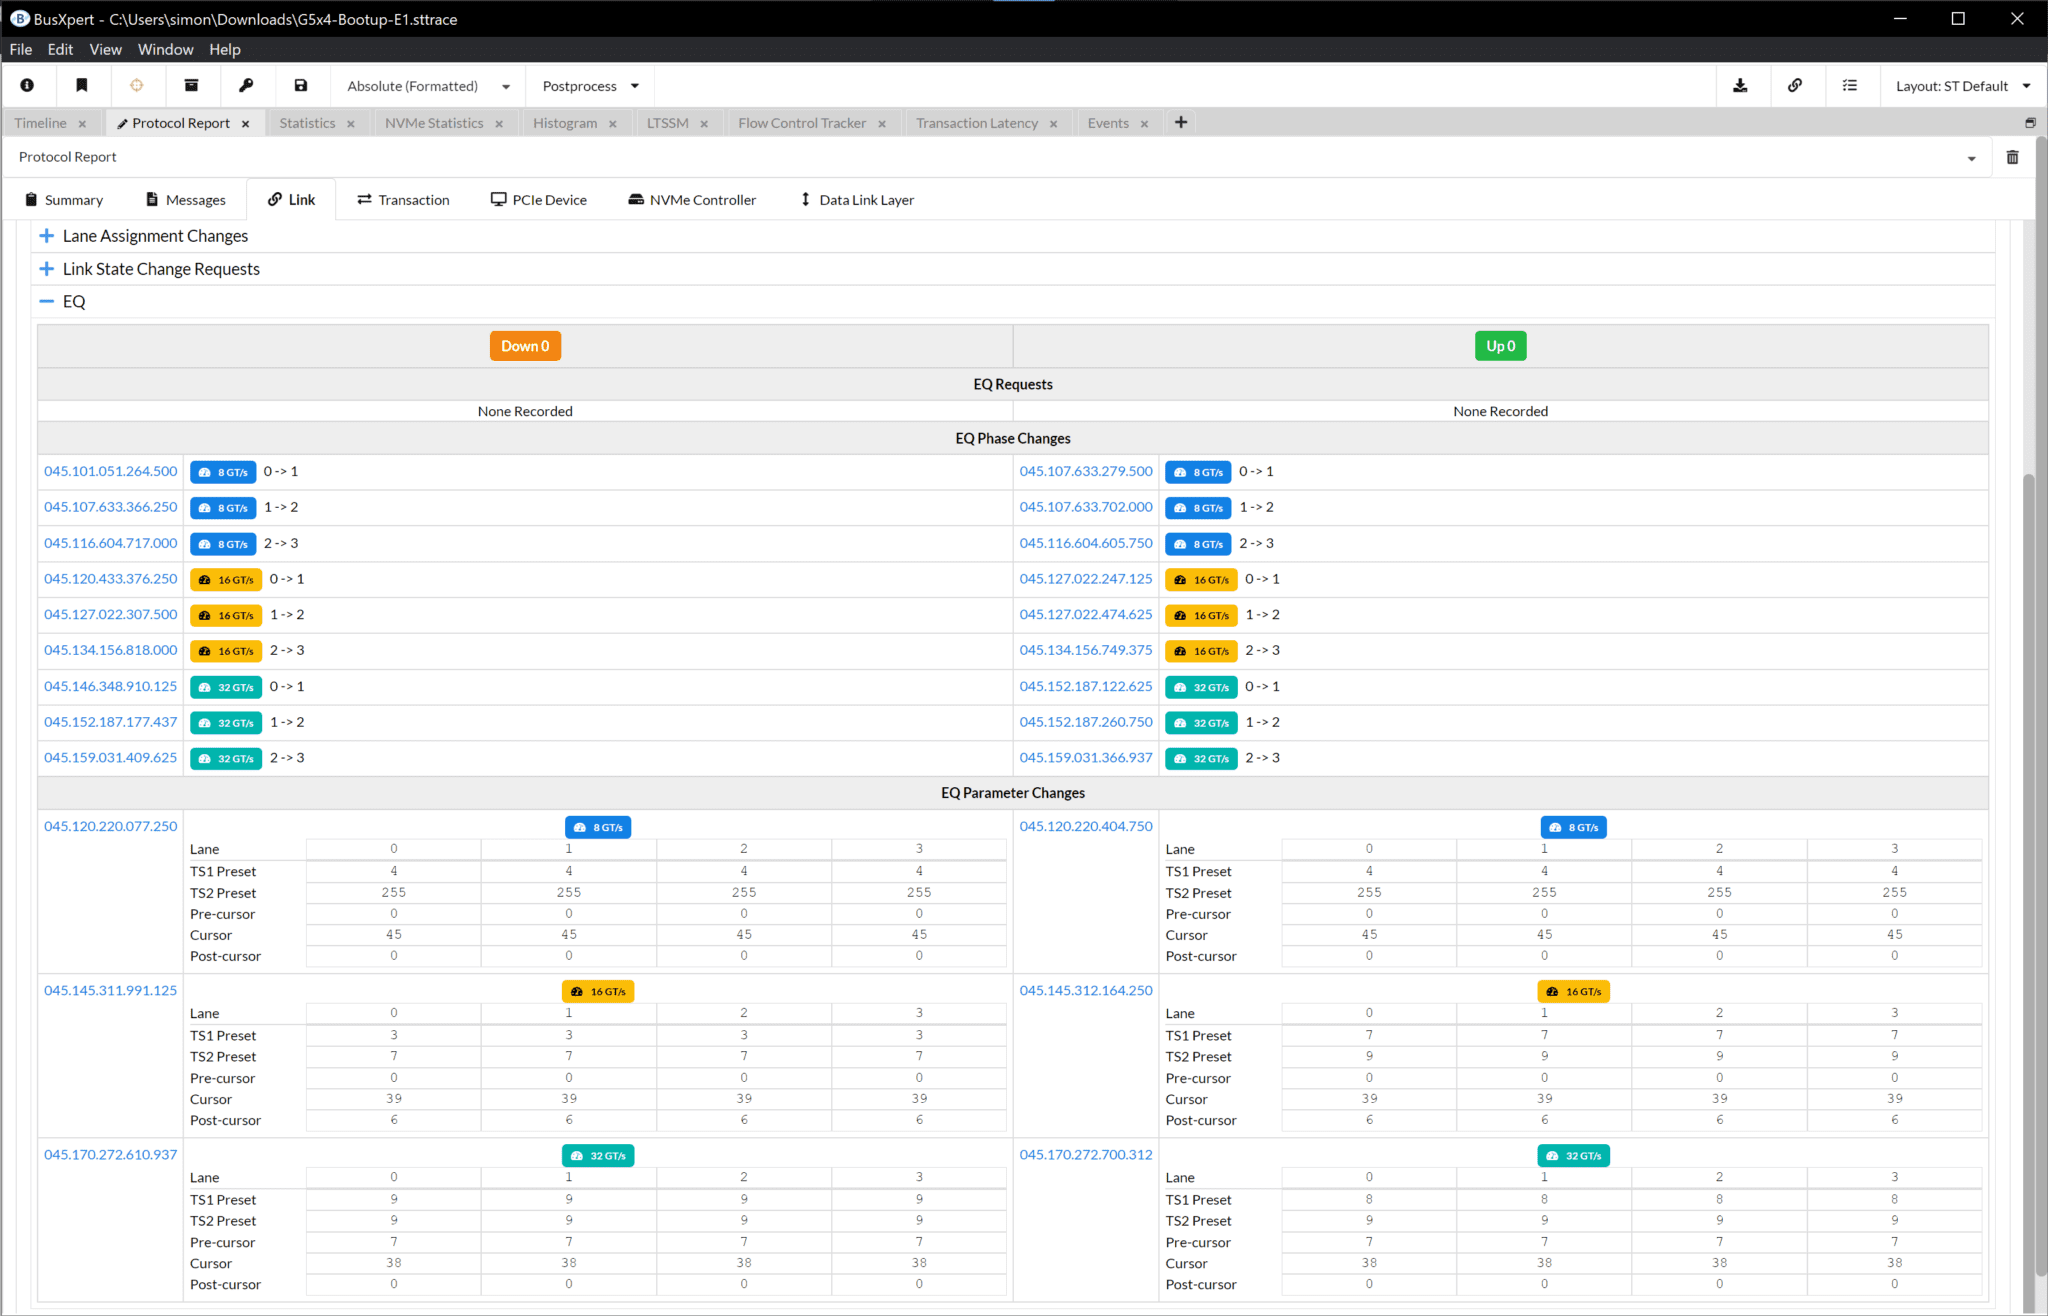
Protocol Reports
Protocol Reports is a comprehensive and customizable reporting tool designed to highlight and summarize changes that occurred in a trace and the protocol information captured. With its intuitive interface and variety of tabs, including Summary, Messages, Link, Transaction, PCIe Devices, NVMe Controller, and Data Link Layer, the Protocol Reports widget provides users with in-depth insights into their data.
Summary Tab
The Summary tab offers a concise overview of the generated report, presenting key information such as creation date, user attribution, total messages and sections available. Additionally, a well-organized table displays the configuration settings of the report, making it easy to track and reference.
Messages Tab
In the Messages tab, users can view a comprehensive table list of all the changes captured by the analyzer. To enhance usability, there are three options for displaying messages based on severity: Informational, Warning, and Error.
Informational:
Presents changes that occurred during the capture, such as link assignments, speed, width, EQ phase, and parameter changes.
Warning:
Displays warnings detected during the capture, allowing users to address potential issues. Examples of warnings include unexpected TLP sequence numbers, flow control update delays, and exhausted flow control credits.
Error:
Highlights errors detected on the link during the capture, including BAR inconsistencies, DLLP CRC errors, unexpected flow control state transitions, and link CRC errors.
Link Tab
The Link tab provides valuable insights into the devices connected to the host system through the analyzer and their assigned Bus Device Function (BDF) identifiers. By offering a quick summary of changes, such as speed, width, link and lane assignments, link state, and equalization request and phase changes, the Link Events section provides a comprehensive view of the system’s connectivity.
Transaction Tab
The Transaction tab offers users a convenient list, complete with timestamps, of all the Transaction Layer Events flagged by the Protocol Report. This feature enables users to easily navigate and analyze key transaction events, enhancing their understanding of the captured data.
PCIe Devices Tab
Like the Archive Management pop-up menu, the PCIe Devices tab gives a full overview of the connected devices. Users can access information such as BDF, Vendor, Device, Subsystem, Class Code, and BARs. Timestamps for essential events such as enumeration, BAR assignment, memory enable, I/O enable, bus master enable, and other capabilities are also included, providing a detailed history of the device’s behavior during host boot up.
NVMe Controller Tab
The NVMe Controller tab offers insights specifically focused on NVMe devices detected in the trace. Users can access information such as BDF, Vendor, Subsystem Vendor, and Device Enable and Ready timestamps. By providing this targeted view, users gain valuable visibility into NVMe device behavior captured in the trace.
Data Link Layer Tab
The Data Link Layer tab focuses on capturing and presenting information pertaining to Link Events that occurred during the trace capture. Examples of captured events include sequence number rollovers, unexpected flow control states, expired flow control updates, exhausted flow control credits, and flow control credit warnings. This section provides crucial information for identifying and addressing link-related issues.
With its comprehensive report structure and user-friendly interface, the Protocol Reports widget empowers users to analyze and understand the data captured during a trace. The widget’s customizable features and pertinent tab options make it an invaluable tool for efficient and accurate analysis.
Statistics
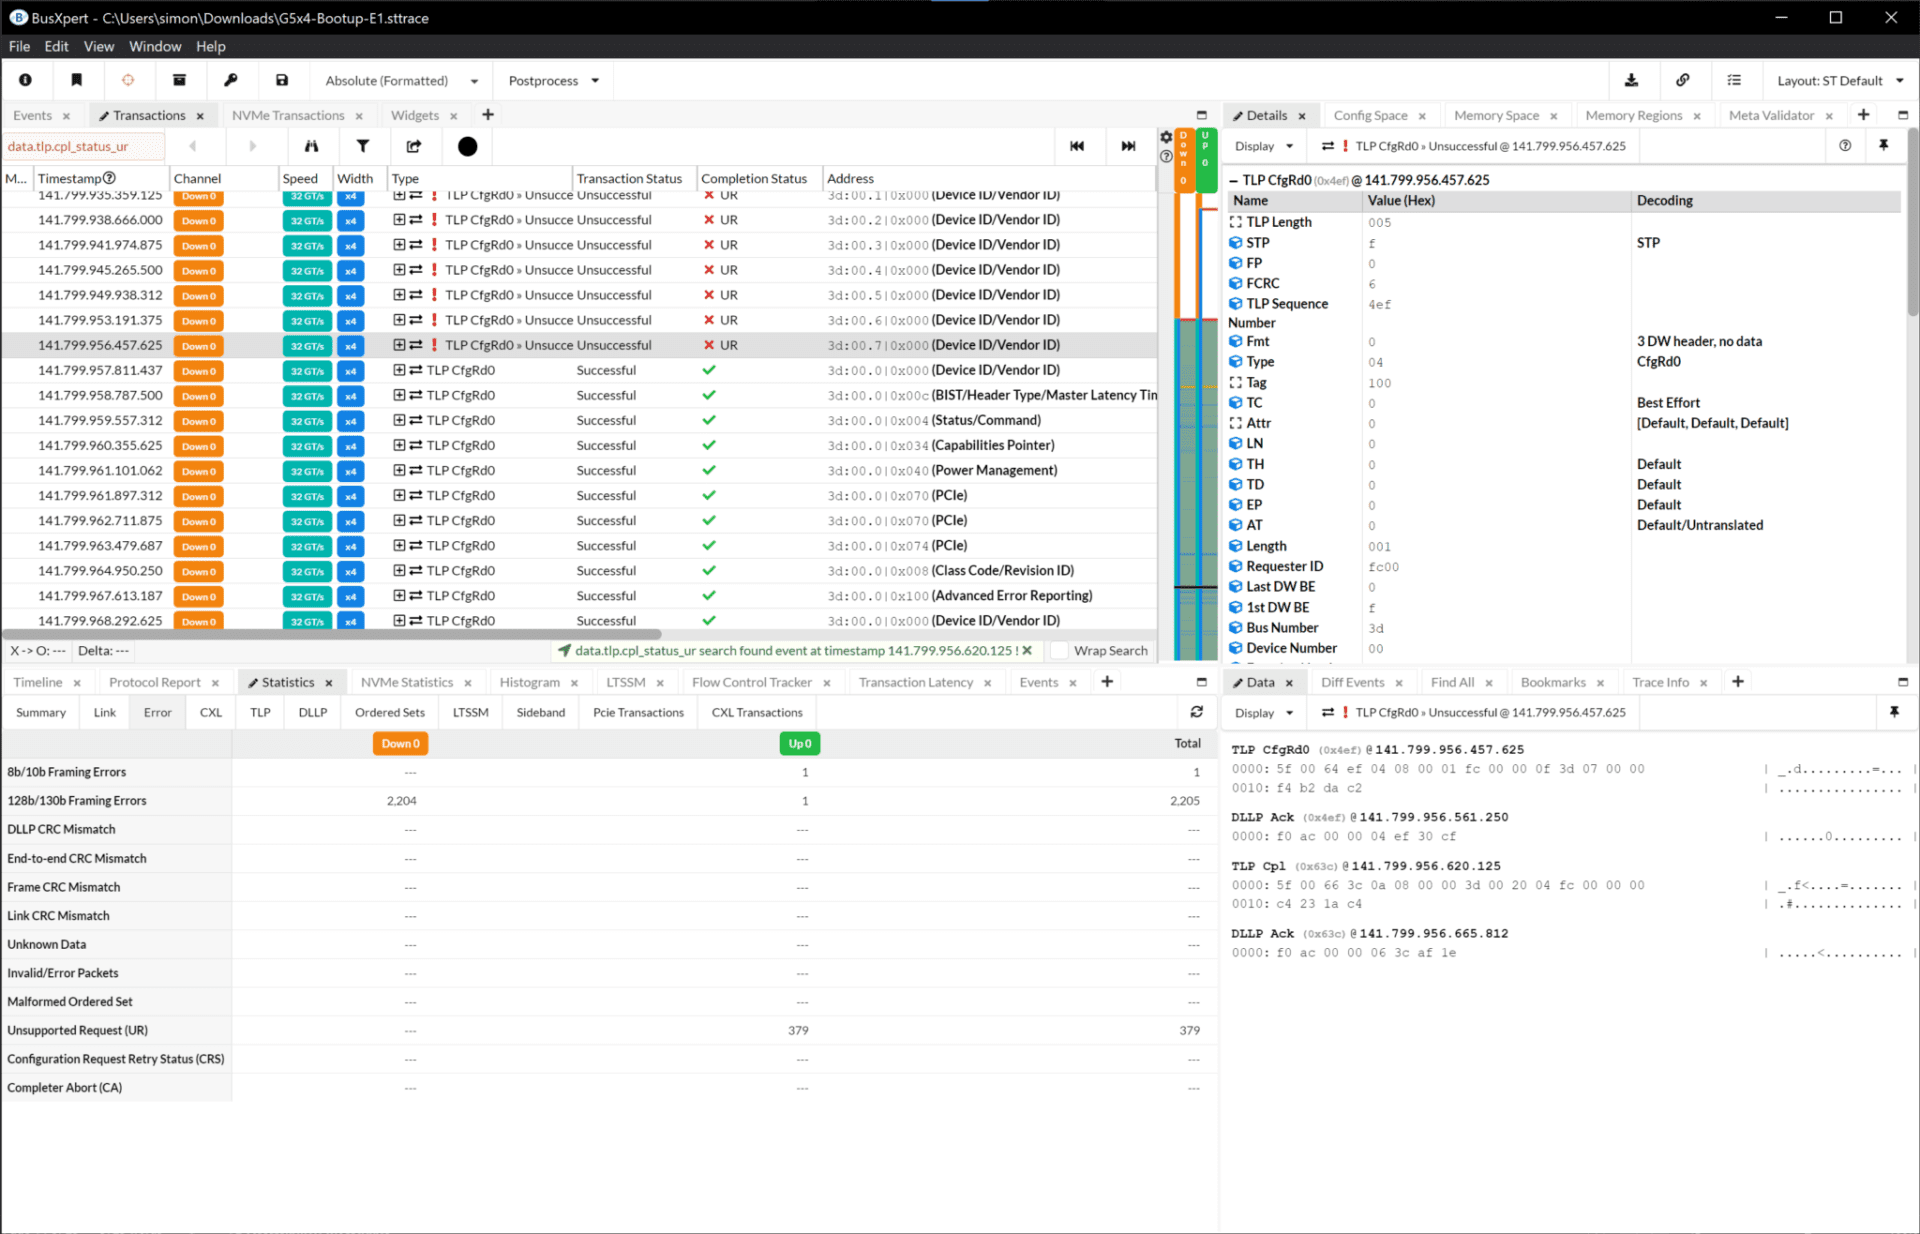
The Statistics widget, featured in the BusXpert software, offers valuable insights into the performance and behavior of the PCIe bus. This widget provides users with a comprehensive statistical analysis of various parameters and metrics related to the bus transactions.
Using the Statistics widget, users can access key information such as bandwidth utilization, error rates, latency, and throughput. The widget presents this data in a structured and easy-to-understand format, allowing users to quickly identify any performance bottlenecks or anomalies that may be impacting the system.
Furthermore, the Statistics widget provides visual representations, such as charts and graphs, to facilitate better data interpretation. These visuals can help users visualize trends, patterns, and variations in the performance metrics over time, enabling them to make informed decisions and take appropriate actions for optimizing the PCIe bus.
By leveraging the Statistics widget, users can gain a comprehensive understanding of the bus performance and proactively address potential issues, ensuring optimal operation and efficiency of the PCIe infrastructure.
Packet Details
The Packet Details widget provides users with a comprehensive view of the specific details and contents of individual packets within the PCIe bus.
This widget offers users two viewing options:
List View: Designed for quick and easy readability, List View presents essential information in a user-friendly format. Users can quickly access important pieces of information related to packet types, data payloads, addresses, and other relevant details.
![]()
Field View: The Field View format, sourced from the PCIe specification, breaks down the packet data into fields according to the specific packet type. This enables users to analyze the textual decodes based on the values in these fields, gaining a more granular understanding of the packet contents.
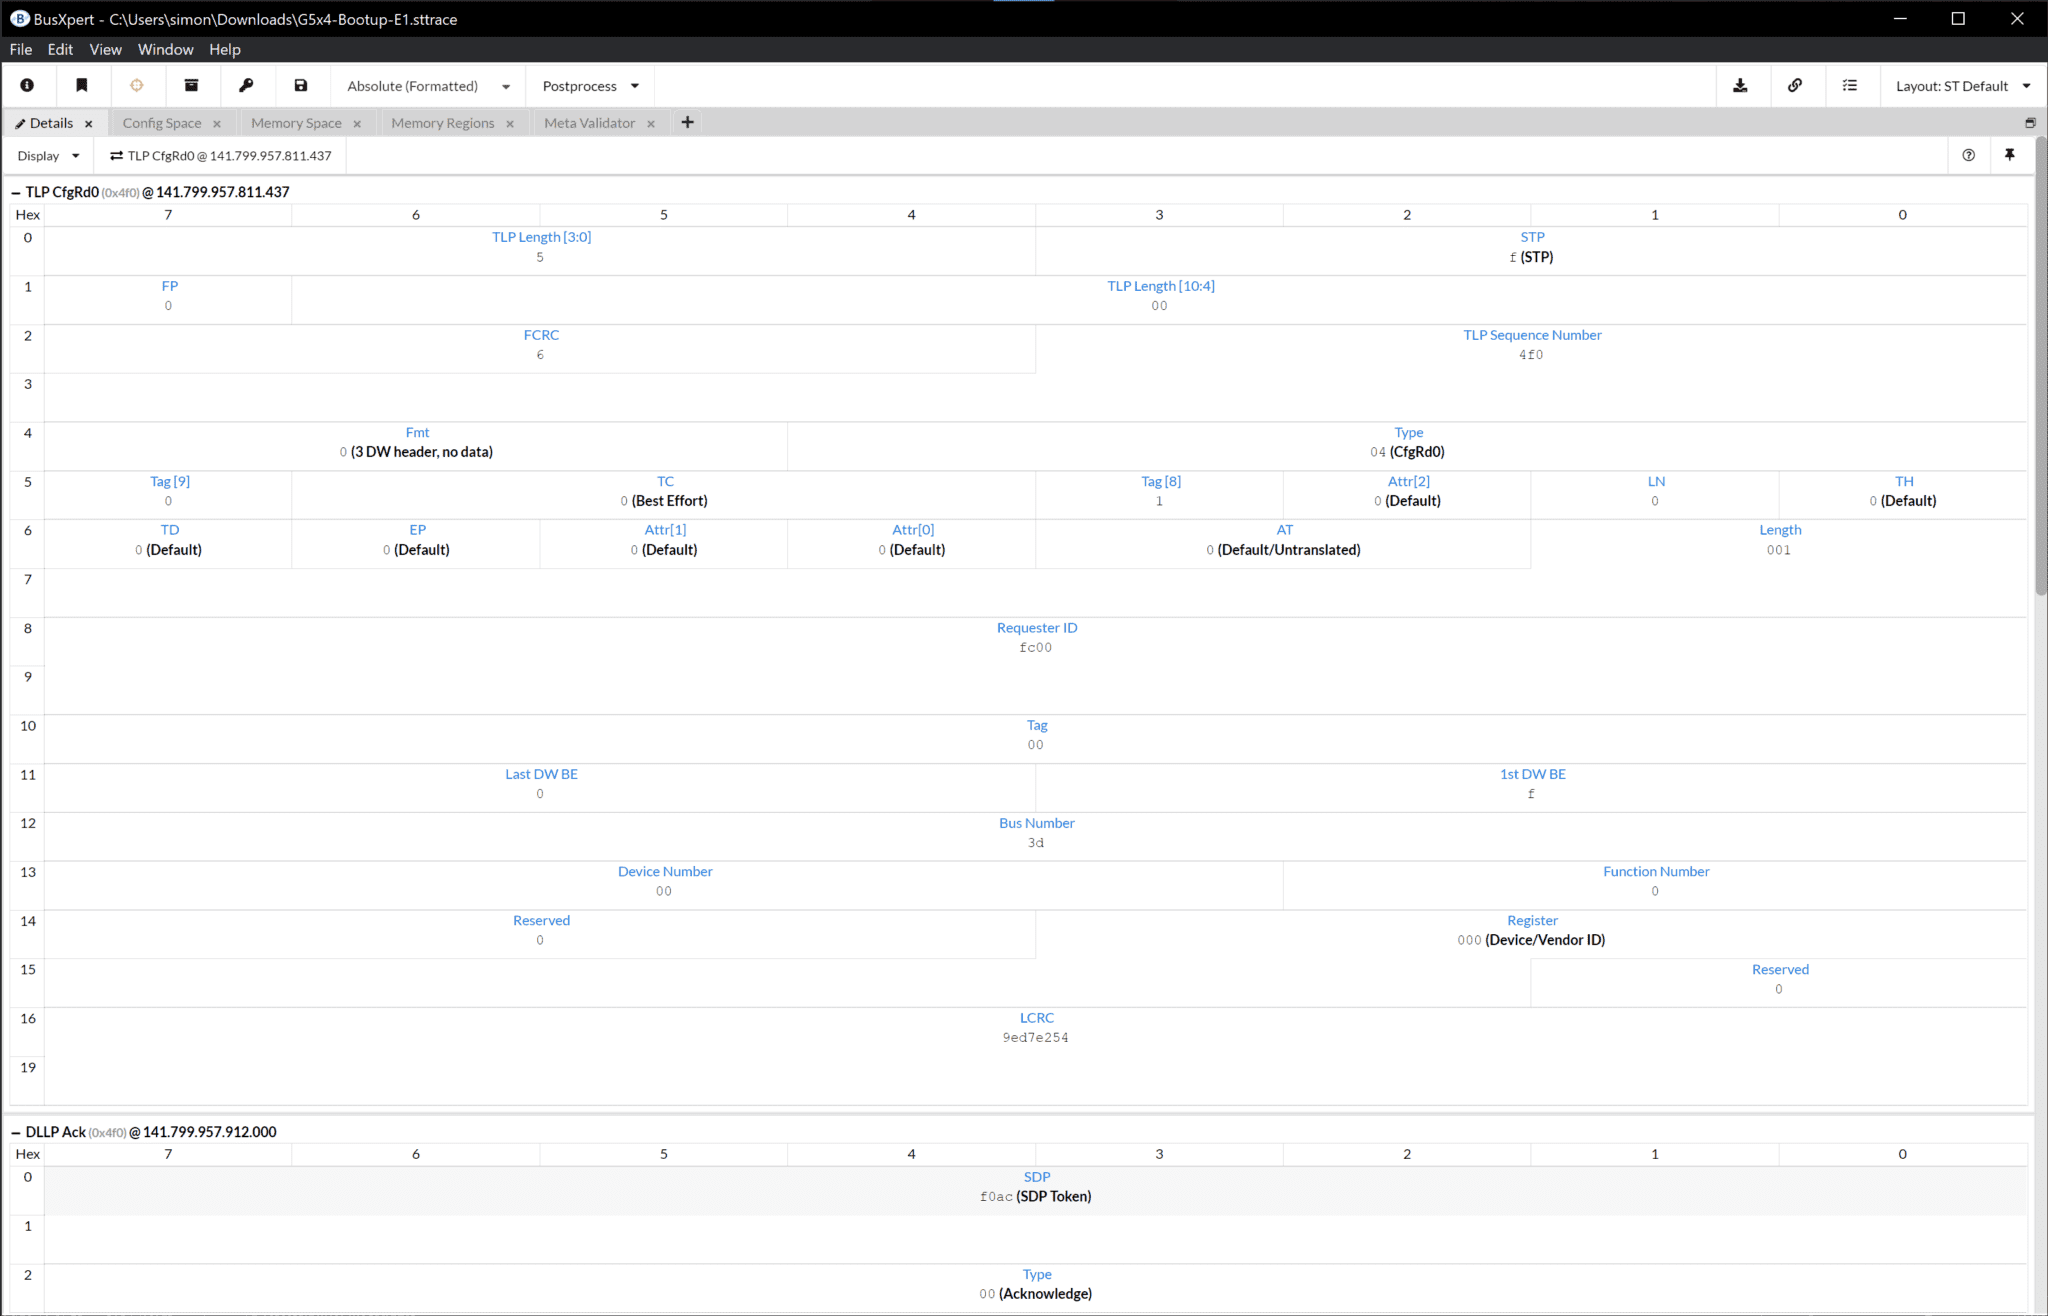
With the Packet Details widget, users can navigate through the trace data and immerse themselves in the intricate details of each packet. This level of visibility and analysis can be immensely valuable for diagnosing issues, verifying protocol compliance, and gaining insights into the behavior and performance of the PCIe bus.
Packet Data
The Packet Data widget is a component that displays the raw bytes of a packet. This widget provides users with the ability to view and manipulate the packet data in several ways to aid in debugging and analysis.
With the Packet Data widget, users have the option to copy the data, format/adjust the column width, and change the Endianness. These features make it easier for users to inspect and modify the packet data according to their specific analysis requirements.
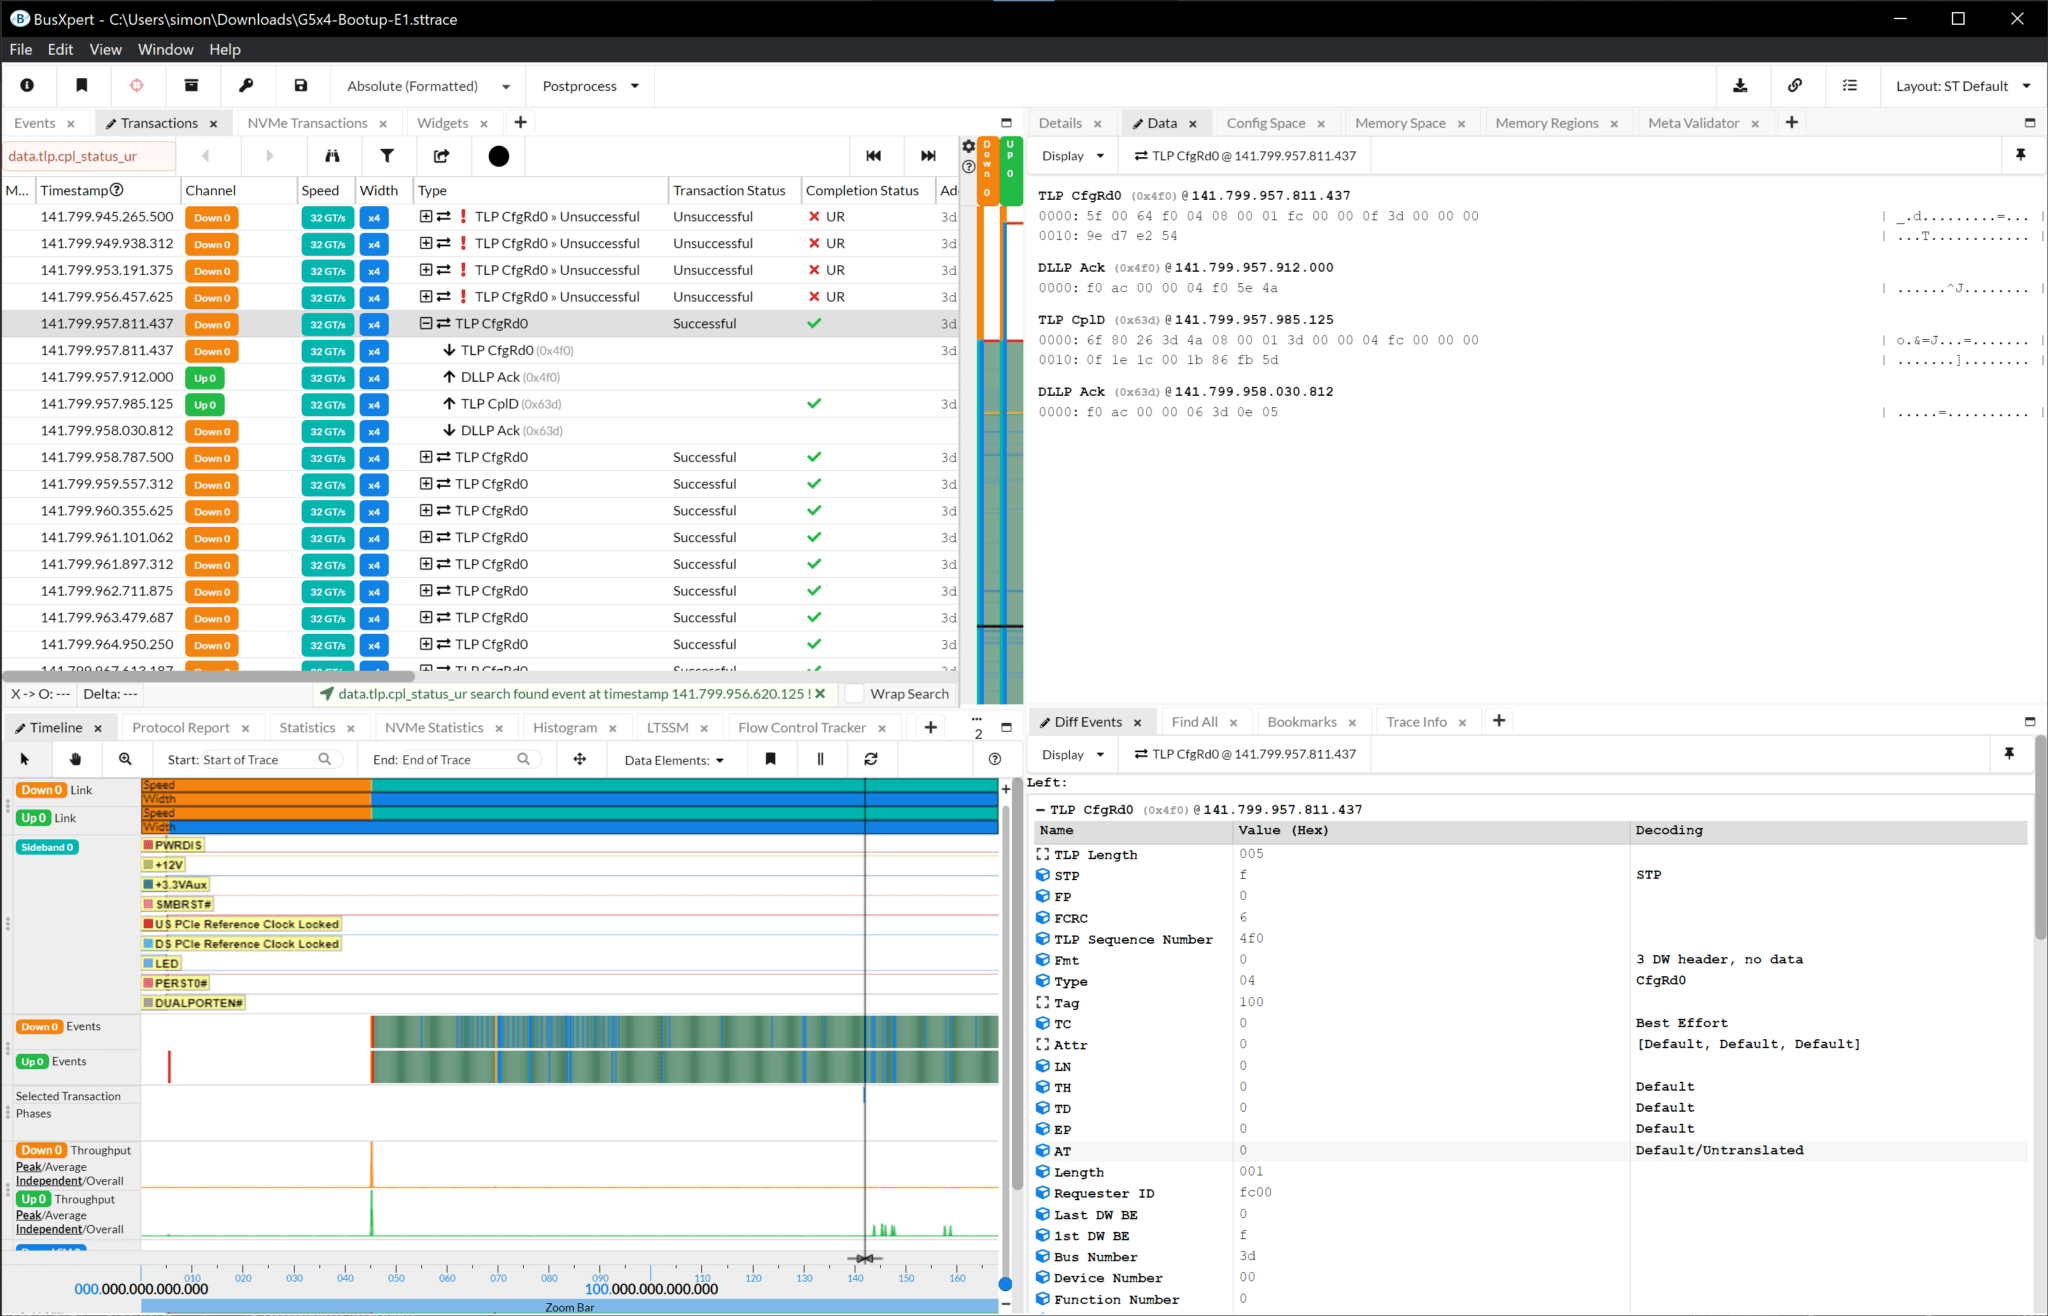
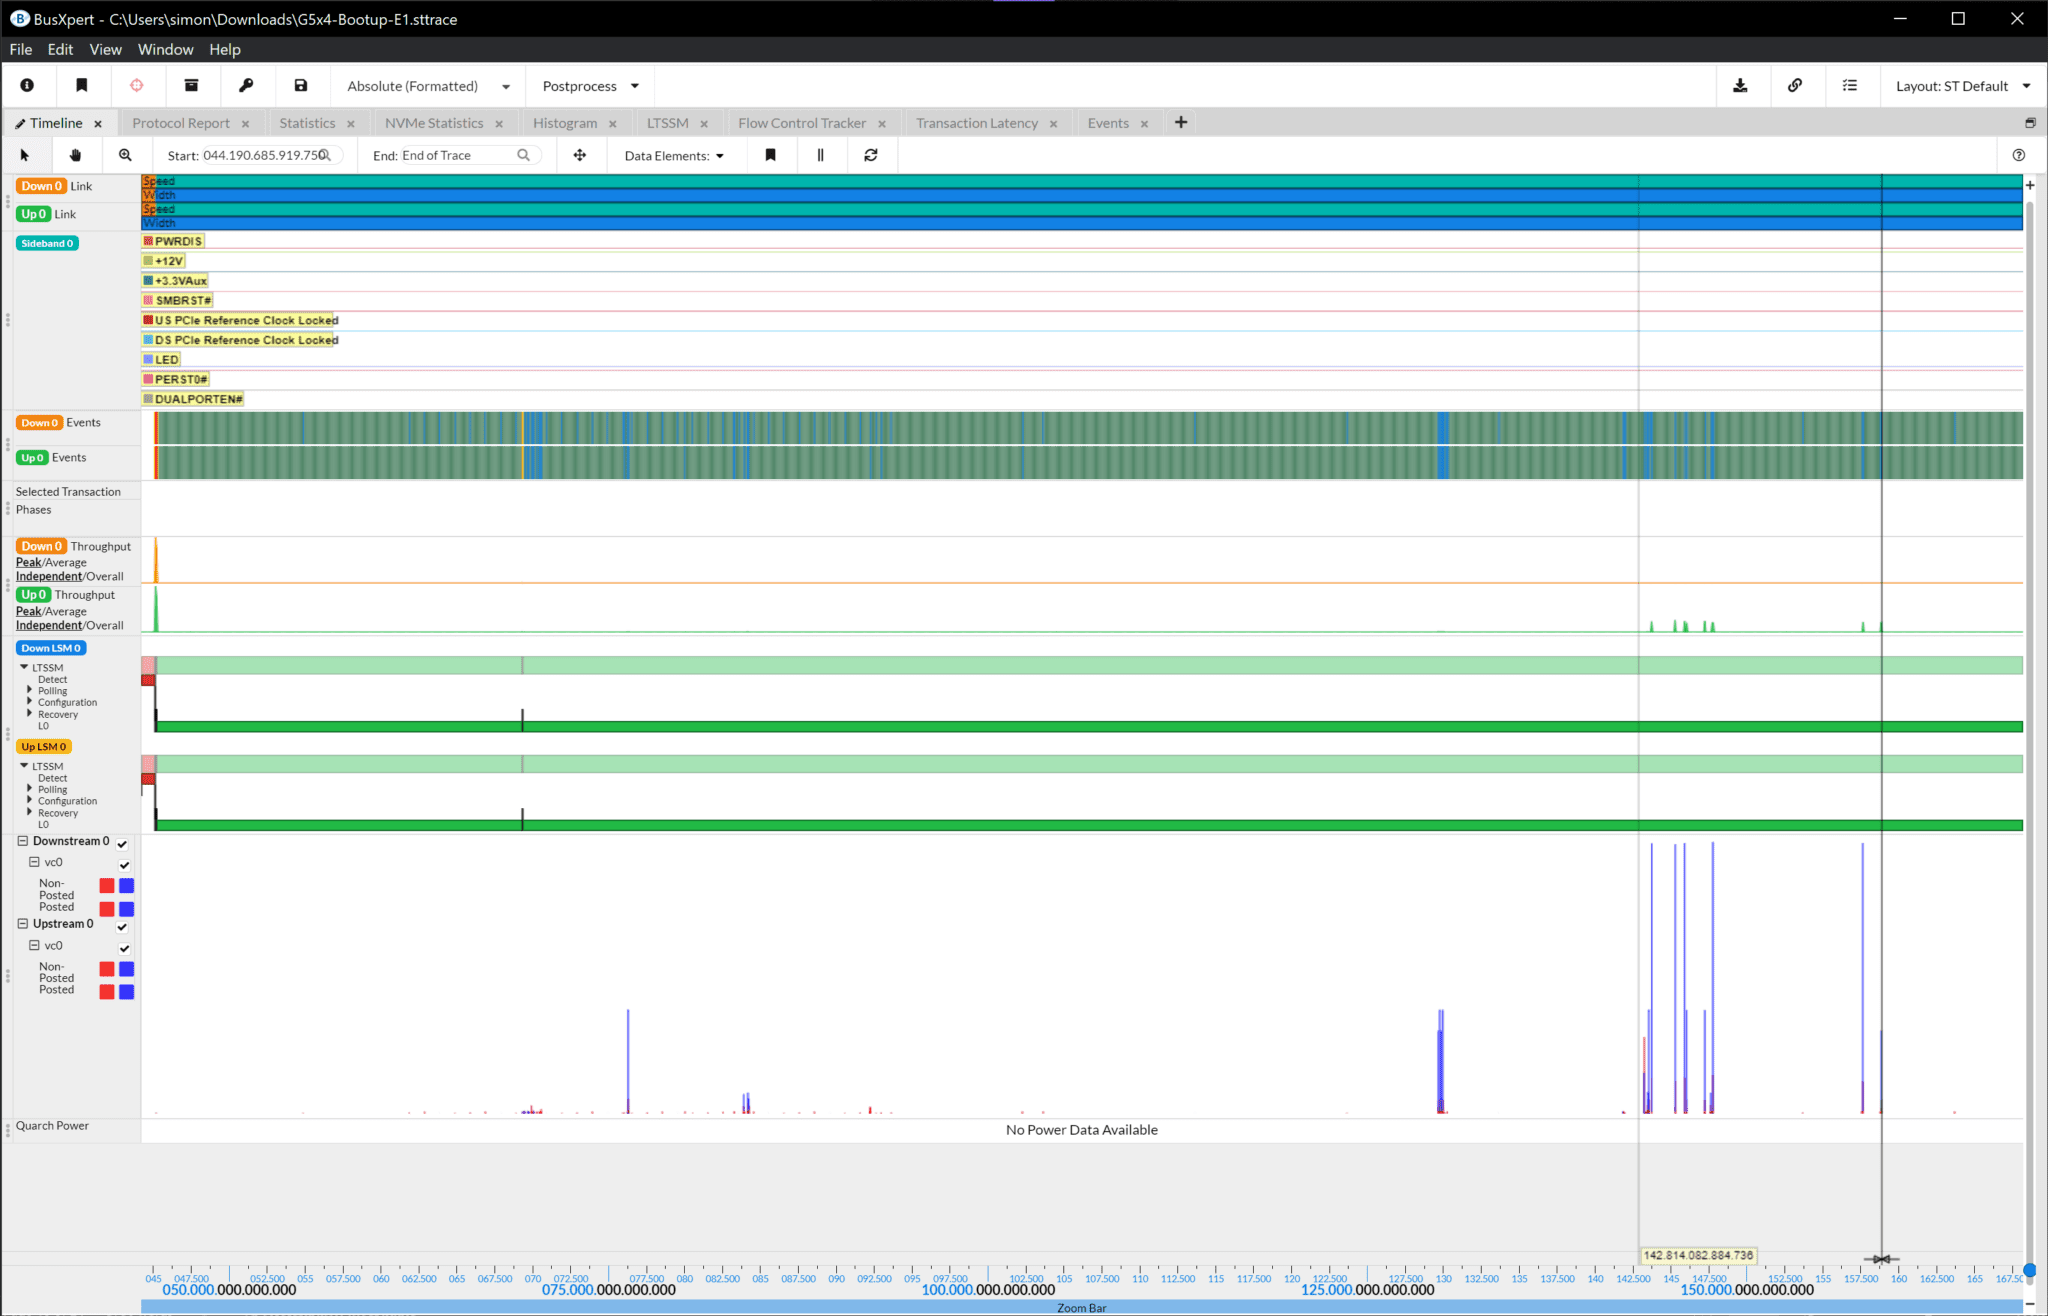
Timeline
The Timeline widget provides users with a visual representation of events and activities that occur within the trace data. It offers a comprehensive view of the timeline, allowing users to navigate through the trace data and gain insights into the chronological order of events.
In the Timeline widget, users can interactively explore the trace data by panning and zooming to focus on specific areas of interest. They can also enable synchronization to ensure that the currently selected event remains in view as they navigate through the timeline.
The Timeline widget allows users to customize their view by choosing which data elements to display, such as sidebands, data, throughput, and other timeline elements. This flexibility ensures that users can focus on the specific elements that are most relevant to their analysis.
Overall, the Timeline widget in the Kodiak PCIe Gen6 Analysis System provides users with a powerful visual representation of the trace data, enabling them to effectively analyze noteworthy events and easily navigate through the timeline for detailed examination.
The LTSSM view is timeline of the “Link Training and Status State Machine” as seen in the trace data. The widget is arranged by up and down streams of the link. The data is shown as a tree that expands out and can be zoomed in to view the data at a finer granularity.
Config Space, Memory Space, and Memory Regions
The Config Space widget is a key component of the Kodiak PCIe Gen6 Analysis System that provides users with two views: the Fields view and the Spec view. This widget also gives the users a detailed view of the Config and Memory space history/changes at the touch of a button.
In the Fields view, the Config Space widget displays data in a list format, allowing users to view important pieces of information. Users can copy the data, change the number format, and visualize the data as either bytes or DWords.
The Spec view, on the other hand, presents the data in accordance with the PCIe specification. It breaks down the data into fields based on the packet type, providing textual decodes based on the values in those fields.
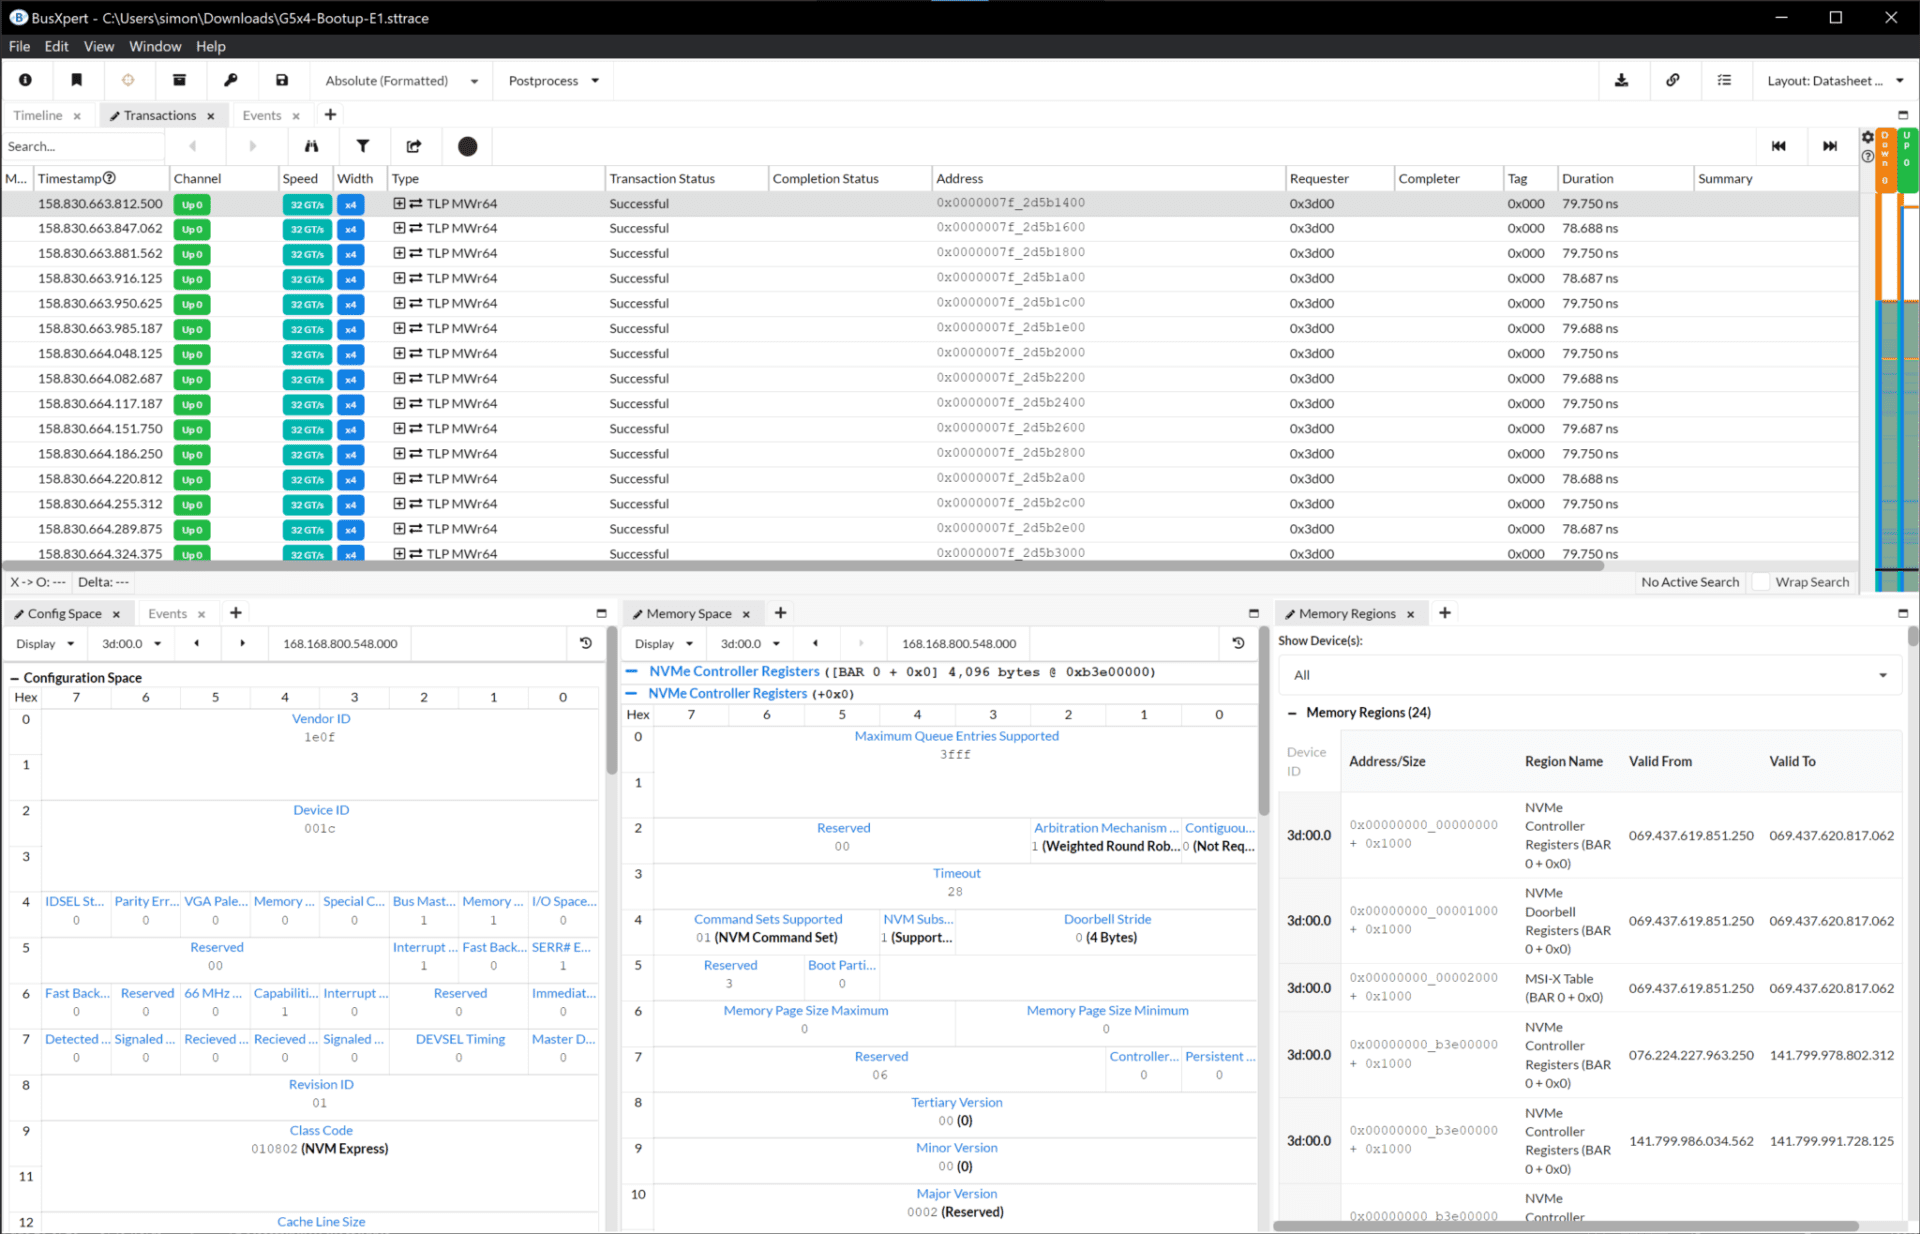
Similarly, the Memory Space widget allows users to explore the memory regions within the PCIe device under analysis. It provides a comprehensive view of the memory space, enabling users to inspect and modify data within different memory regions.
Moreover, the Memory Space widget offers various features to enhance analysis. Users can customize the view by choosing to display only specific memory regions or by pinning important data fields for quick reference. The widget also facilitates tasks like copying data, modifying number formats, and visualizing the data in bytes or DWords.
The Memory regions widget is another component of the Kodiak PCIe Analysis System that allows users to examine specific memory regions within the device. Users can select and explore desired memory regions to gain a deeper understanding of the data contained within.
In summary, the Config Space widget, Memory Space widget, and Memory regions widget in the Kodiak PCIe Gen6 Analysis System provide users with powerful tools to analyze data within the configuration and memory spaces of PCIe devices.
Additional Widgets / Functions
- Real-time Link Statistics
- Diff Events: Compares two PCIe packets
- Global & User Bookmarks
- Trace Summary Information
- Buffer Status
- LED’s
Kodiak CXL PCIe 6.0 Tester
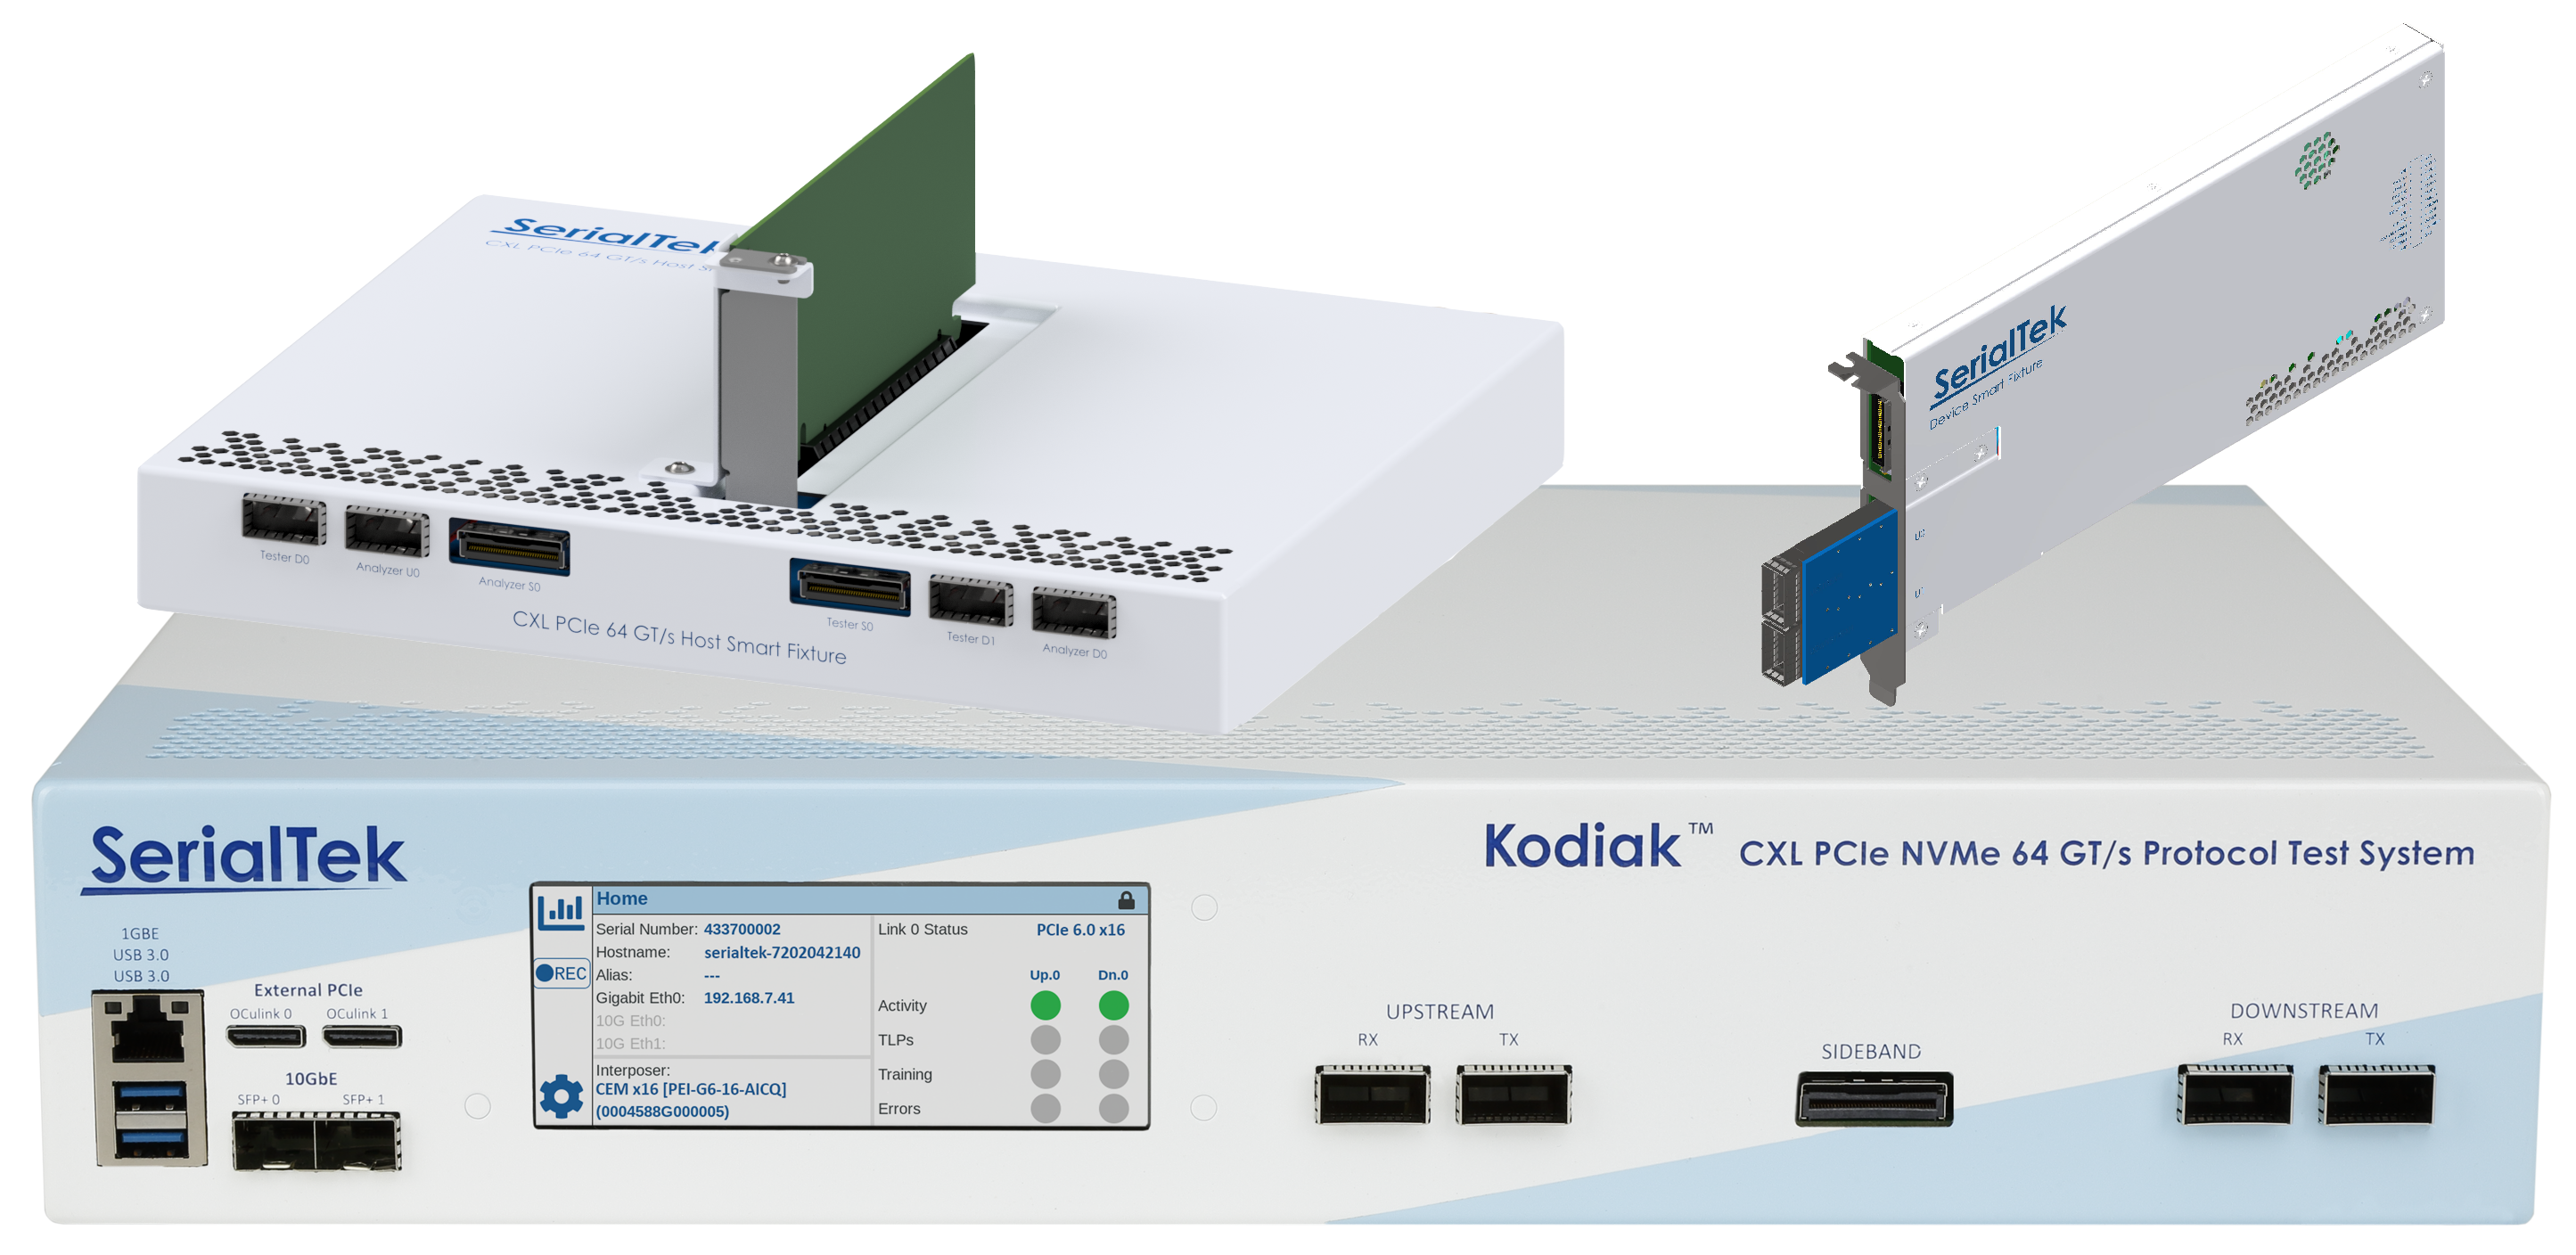
The Kodiak PCIe 6.0 / CXL 3.0 Protocol Tester is a powerful tool designed for testing and validating PCI Express and CXL technologies. It offers a wide range of features to ensure compliance, validate spec-compliant behaviors, and optimize device and system performance. Here are the key benefits and capabilities of the Kodiak tester:
1. Ensure Compliance and Validate Quality:
– Verify conformance to the PCIe Certification Test Suite (CTS) and SerialTek-specific quality test suites.
– Validate the implementation against industry standards for robustness and quality.
2. Access Testing When Hosts and Devices Are Unavailable:
– Overcome challenges of limited access to hosts and devices by using the tester for early testing and troubleshooting.
3. Troubleshoot Specific Problems:
– Convert traces with issues into reproducible tests for troubleshooting purposes.
4. Verify Specific Features:
– Test and validate features such as Data Object Enable (DOE), Integrity and Data Encryption (IDE), and Link Training and Status State Machine (LTSSM) state transitions.
5. Manual Testing and Customization:
– Allow users to modify capabilities and perform limited manual testing, such as sending specific TLPs or testing responses to malformed TLPs.
6. Early Performance Testing:
– Perform performance testing at various stages of development to optimize device and system performance.
7. The tester supports multiple modes, including Compliance Test Mode,
– Manual Test Mode, Loopback Mode, Feature Test Mode, Trace Replay Mode, Performance Test Mode, and Pattern Generator Mode.
For CXL compliance testing, the tester follows the guidelines outlined in the CXL specification, covering various layers such as CXL.io and CXL.cache Application Layer/Transaction Layer testing, Link Layer testing, ARB/MUX, Switch Tests, and Configuration Register Tests.
In addition, the Kodiak tester offers a comprehensive compliance suite for PCIe with tests covering Link Layer, Transaction Layer, and Protocol functionalities.
The Manual Mode allows users to emulate a host or device environment, modify configuration space, change LTSSM states, and force sideband signals for comprehensive validation. This mode enables testing of specific features and behaviors defined in the protocol specifications.
The tester provides a user-friendly software interface with script building capabilities, allowing users to create customized test scenarios.
For performance optimization, the Kodiak tester offers effortless performance testing and automation through a web-based interface and a flexible REST API. It also provides real-world simulation capabilities to mimic various scenarios and conditions.
The tester ensures thorough testing at every stage of development, helping identify performance bottlenecks and optimize data transfer rates. It offers detailed performance metrics, analysis of test results, and data-driven decision-making tools.
Experience the full potential of your technology with the Kodiak PCIe 6.0 / CXL 3.0 Protocol Test System and achieve superior performance and compliance for your devices or systems.
Kodiak Enclosure
- Dimensions: 443 x 81 x 331 mm (17 x 3.2 x 13”)
- Weight: 8 kg (17.6 lbs)
- Mounting: 19” Rack Mount Option, Tilt Feet Option
- Ambient Operating Temperature: 5-35°C at up to 2133m (7000 feet) altitude
Displays and Indicators
- Front Panel LCD: 800×320 4.6” WCGA, Touchscreen
- System Status: RGB LED
Front-Panel Connectors
- Interposer Connection: 4x QSFP-DD & 1x MCIO
- Ethernet (10 GbE): 2x SFP+ Ports
- Ethernet (1 GbE): RJ45
- PCIe Interface: 2x OCuLink
- USB Interface: 2x USB 3.2 Type A
Rear-Panel Connectors
- Power: IEC C13, 100-240 Vac, 50-60 Hz
- Clock Out: SMA, 50 Ω, 3.3 Vdc, 10 MHz
- Clock In (10 MHz): SMA, 50 Ω, 3.3 Vdc, 10 MHz
- Trigger Out: SMA, 50 Ω, 3.3 Vdc
- Trigger In: SMA, 50 Ω, 3.3 Vdc
- Maintenance: RJ45, USB Micro-B (Not for customer use)
Maintenance and Licensing
- Free lifetime software updates – no maintenance fees
- Free full-featured viewer software – easily share annotated traces between computers and colleagues and replay captured traffic
- Use SerialTek hardware on any computer – no additional licenses required
Warranty
- Three-year limited warranty, Enterprise Edition
- Six-month limited warranty (12-months extended warranty available), Interposers
| Kodiak PCIe 6.0/CXL 3.0 x16 Protocol Test System | |
|---|---|
| Kodiak PCIe 6.0 x16 Protocol Analyzer and Tester – Enterprise Edition. 256GB Buffer, 8TB SSD, 2x 10GE, 3YR Warranty Analyzer License for PCIe 6.0, CXL, SMBUS, DOE, IDE, PAM Tester License for CXL/PCIe 6.0, SMBus, CTS, Manual Mode |
PK3-G6-16-ENT |
| Kodiak PCIe 6.0 x8 Protocol Analyzer and Tester – Enterprise Edition. 256GB Buffer, 8TB SSD, 2x 10GE, 3YR Warranty Analyzer License for PCIe 6.0, CXL, SMBUS, DOE, IDE, PAM Tester License for CXL/PCIe 6.0, SMBus, CTS, Manual Mode |
PK3-G6-08-ENT |
| Kodiak PCIe 6.0 x4 Protocol Analyzer and Tester – Enterprise Edition. 256GB Buffer, 8TB SSD, 2x 10GE, 3YR Warranty Analyzer License for PCIe 6.0, CXL, SMBUS, DOE, IDE, PAM Tester License for CXL/PCIe 6.0, SMBus, CTS, Manual Mode |
PK3-G6-04-ENT |